
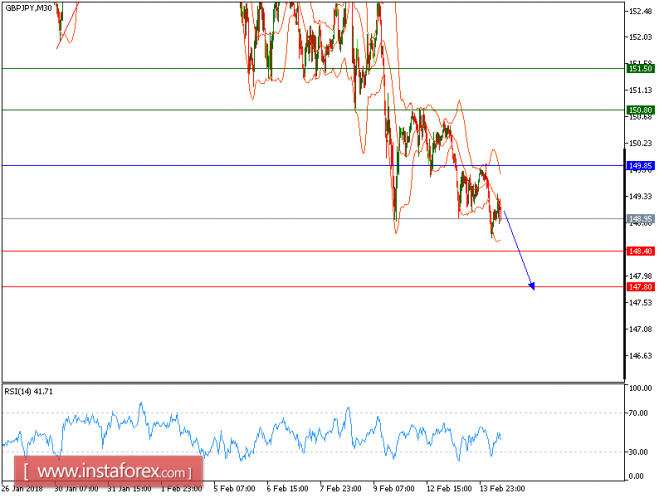
Our first target which we predicted in previous analysis has been hit. The pair retreated and broke below the 20-period moving average after failing to penetrate above the key resistance at 149.85. The relative strength index is below its neutrality level at 50 and lacks upward momentum.
Hence, as long as 149.85 holds on the upside, look for a new drop with targets at 148.40 and 147.80 in extension.
Alternatively, if the price moves in the direction opposite to the forecast, a long position is recommended to be above 149.85 with the target at 150.80.
Strategy: SELL, Stop loss at 149.85, Take profit at 148.40
Chart Explanation: the black line shows the pivot point. The price above the pivot point indicates long positions; and when it is below the pivot point, it indicates short positions. The red lines show the support levels, and the green line indicates the resistance levels. These levels can be used to enter and exit trades.
Resistance levels: 150.80, 152.10, and 153.00
Support levels: 148.40, 147.80, and 147.00.
The material has been provided by InstaForex Company - www.instaforex.com