
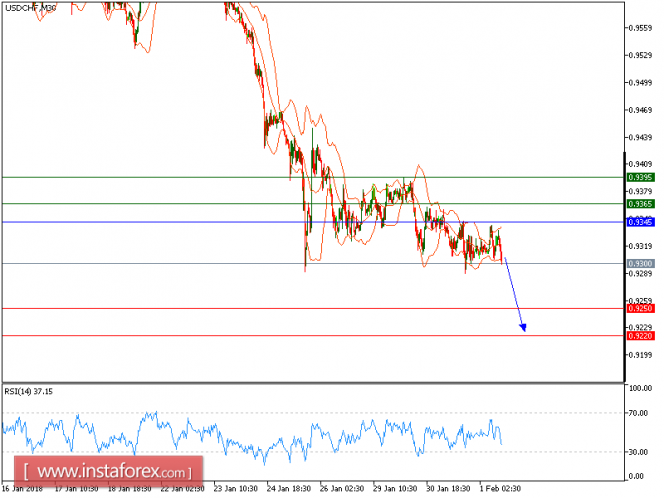
USD/CHF is under pressure and is capped by a falling trend line. The pair remains under pressure below its declining trend line. The relative strength index is also negative below its neutrality area at 50. The falling 50-period moving average acts as a resistance role, and should continue to push the prices lower.
To sum up, as long as 0.9345 is not surpassed, look for a new drop to 0.9250 and 0.9220 in extension.
Chart Explanation: The black line shows the pivot point. The present price above the pivot point indicates a bullish position, and the price below the pivot point indicates a short position. The red lines show the support levels, and the green line indicates the resistance levels. These levels can be used to enter and exit trades.
Strategy: SELL, stop loss at 0.9345, take profit at 0.9250.
Resistance levels: 0.9365, 0.9395, and 0.9430
Support levels: 0.9250, 0.9220, and 0.9200.
The material has been provided by InstaForex Company - www.instaforex.com