
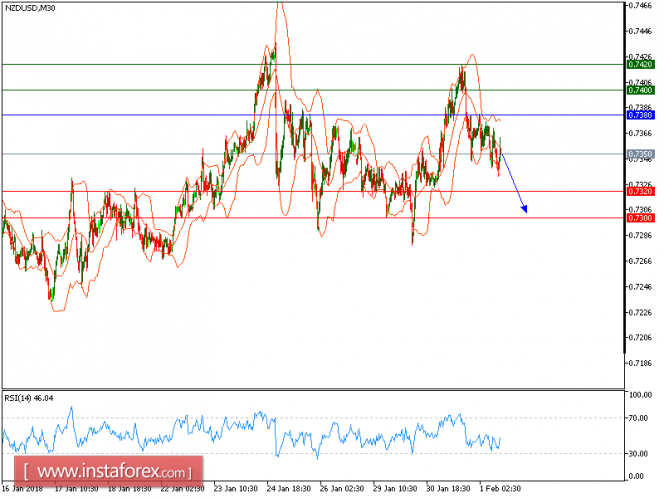
NZD/USD is under pressure. The pair has clearly reversed down after the failure to break above its key resistance at 0.7420. The 20-period moving average is turning down, and also crossed below the 50-period one. The relative strength index is bearish below its neutrality area at 50.
Therefore, as long as 0.7380 is resistance, likely decline to 0.7320 and 0.7300 in extension.
The black line shows the pivot point. Currently, the price is above the pivot point, which is a signal for long positions. If it remains below the pivot point, it will indicate short positions. The red lines are showing the support levels, while the green line is indicating the resistance levels. These levels can be used to enter and exit trades.
Resistance levels: 0.7400, 0.7420, and 0.7450.
Support levels: 0.7320, 0.7300, and 0.7260.
The material has been provided by InstaForex Company - www.instaforex.com