
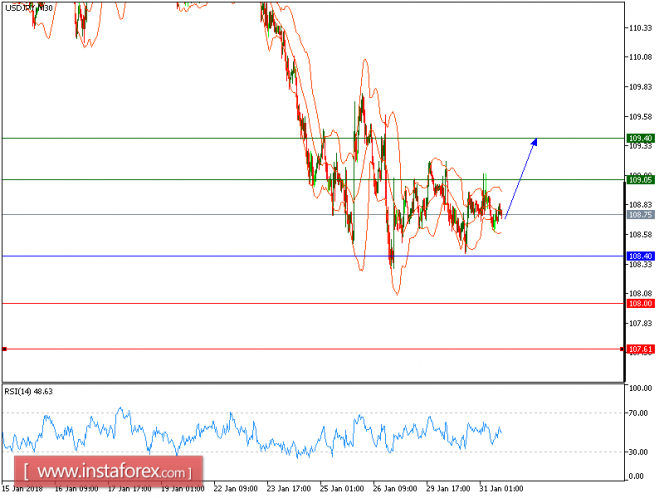
USD/JPY is expected to trade with a bullish bias above 108.40. On a 30-minute chart, the pair marked a day-low of 108.38 yesterday (January 30) before posting a rebound. Currently, the pair is trading at levels around the ascending 20-period moving average, which has just crossed above the 50-period one. And the relative strength index has managed to stay above the neutrality level of 50, indicating a lack of downward momentum for the pair. As long as intraday bullishness is maintained, the pair should revisit 109.40 on the upside.
Alternatively, if the price moves in the opposite direction, a Short position is recommended to be below 108.40 with a target of 109.20.
Chart Explanation: The black line shows the pivot point. The current price above the pivot point indicates a bullish position, while the price below the pivot point is a signal for a short position. The red lines show the support levels, and the green line indicates the resistance level. These levels can be used to enter and exit trades.
Strategy: BUY, stop loss at 108.40, take profit at 109.40.
Resistance levels: 109.05, 109.40, and 109.80
Support levels: 108.00, 107.60, and 107.30.
The material has been provided by InstaForex Company - www.instaforex.com