
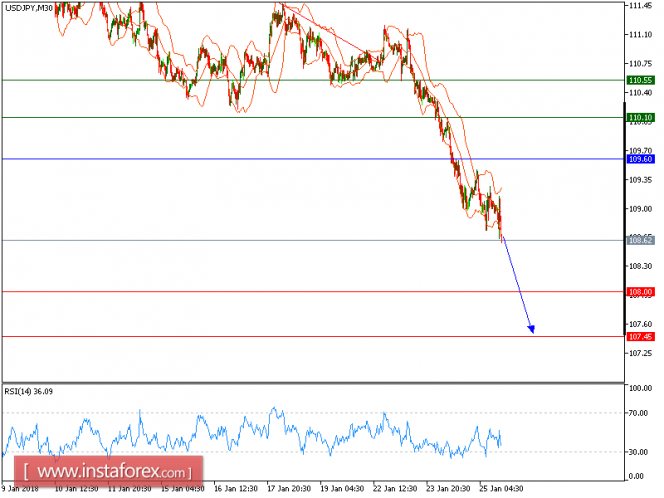
Our downside targets which we predicted in yesterday's analysis have been hit. USD/JPY is under pressure. Though the pair made a rebound, it is still capped by a declining 50-period moving average. The upside potential should be limited by the key resistance at 109.60. Even though a continuation of technical rebound cannot be ruled, its extent should be limited.
To conclude, as long as 109.60 is not surpassed, look for another drop with targets at 108.00 and 107.45 in extension.
Alternatively, if the price moves in the opposite direction, a long position is recommended above 109.60 with a target of 1110.10.
Chart Explanation: The black line shows the pivot point. The current price above the pivot point indicates a bullish position, while the price below the pivot point is a signal for a short position. The red lines show the support levels and the green line indicates the resistance level. These levels can be used to enter and exit trades.
Strategy: SELL, stop loss at 109.60, take profit at 108.00.
Resistance levels: 110.10, 110.55, and 110.75
Support levels: 108, 107.45, and 107.
The material has been provided by InstaForex Company - www.instaforex.com