MG Network

something big isHappening!

In the mean time you can connect with us with via:

Copyright © Money Grows Network | Theme By Gooyaabi Templates

Money Grows Network

Archive

Powered by Blogger.

Welcome To Money Grows Network

Verified By

2006 - 2019 © www.moneygrows.net

Investments in financial products are subject to market risk. Some financial products, such as currency exchange, are highly speculative and any investment should only be done with risk capital. Prices rise and fall and past performance is no assurance of future performance. This website is an information site only.

Popular

Pages

Expert In

Name*


Message*

Ichimoku cloud indicator analysis of gold for January 26, 2018

Gold price reversed from $1,266 level towards $1,340 to back test the break out level as expected. So far, the back test was successful as price is bouncing strongly back above $1,355.

analytics5a6adf6068a10.png

Magenta line - long-term resistance

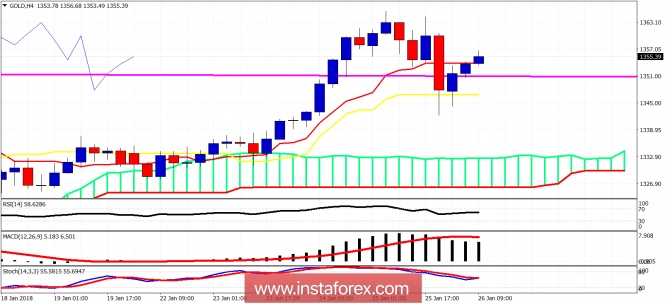
Gold price remains in a bullish trend. Kijun-sen support at $1,346 was respected in the 4 hour chart. Price remains above the Ichimoku cloud. Support is at $1,342 now, and resistance is at $1,365. Break above $1,365 and we go towards $1,389. Break support and we go to $1,330-20.

analytics5a6adfc978623.png

Magenta line -long term resistance

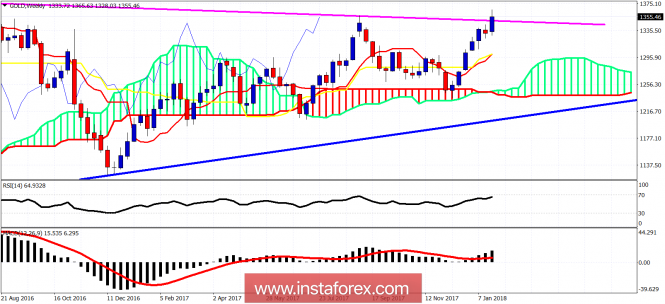
Blue line - long-term support

On a weekly basis, Gold is breaking out. Gold is above the long term resistance and remains bullish in all time frames. A weekly close below $1,332 would only cancel the bullish trend and give a reversal signal.

The material has been provided by InstaForex Company - www.instaforex.com