
Gold price continues to trade above the $1,320-$1,309 support area where it last made a consolidation before the breakout to $1,345. Trend remains bullish in the medium-term. Important long-term resistance is at $1,350.
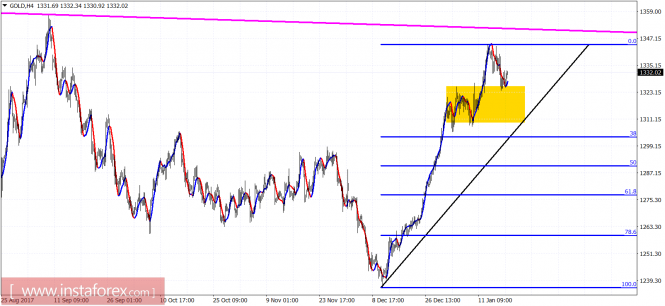
Gold price has made a sharp rise off the $1,237 lows in past December and has reached the long-term resistance of $1,350. Price is expected to pull back towards the 38% Fibonacci retracement at least. Only a break below $1,260 could signal that a decline below $1,237 is possible.
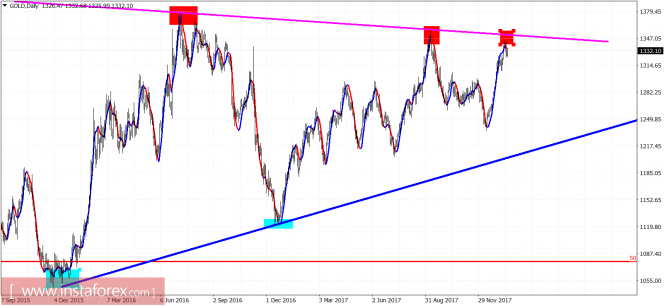
Blue line - long-term support
Magenta line -long-term resistance
Gold price has reached important resistance area. A rejection here is very possible. A lower high on a Daily basis here could signal a move lower even towards the long-term blue trend line support. The slope of the rise was very sharp and stopped right at the triangle resistance. I expect a pull back.
The material has been provided by InstaForex Company - www.instaforex.com