
The index managed to find dynamic resistance in the 200 SMA at the H1 chart and a leg lower towards the support zone of 90.59 is expected to happen in coming hours. The greenback was under heavy selling pressure during Friday's session and it could remain in favor of the bears during the week. If it does a break below the 90.59 level, then the next target would be the 89.36 zone.
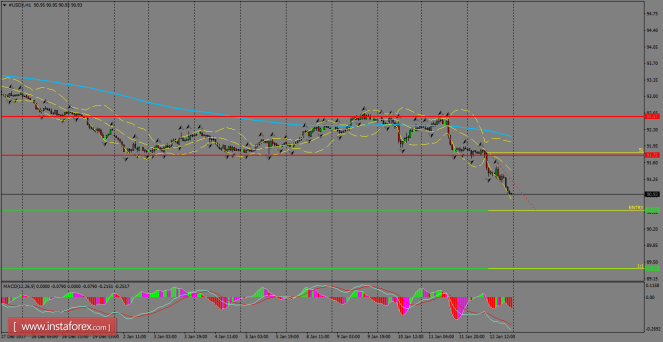
H1 chart's resistance levels: 91.75 / 92.57
H1 chart's support levels: 90.59 / 89.36
Trading recommendations for today: Based on the H1 chart, place sell (short) orders only if the USD Index breaks with a bearish candlestick; the support level is at 90.59, take profit is at 89.36 and stop loss is at 91.81.
The material has been provided by InstaForex Company - www.instaforex.com