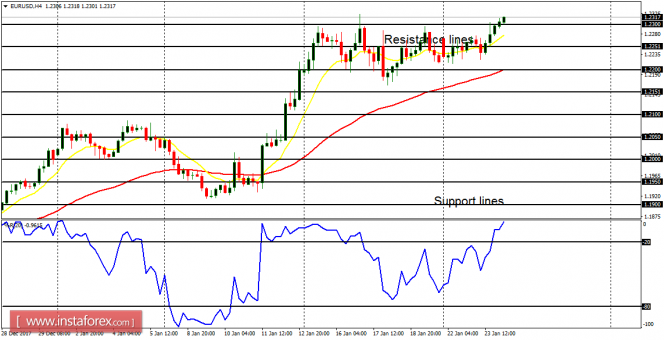
EUR/USD: Following the recent consolidating in the market, price has broken out to the upside. There is a Bullish Confirmation Pattern in the 4-hour chart, and therefore, price may be able to go further upwards, reaching the resistance lines at 1.2350, 1.2400, and 1.2450. Those are the targets for the remaining of this week.
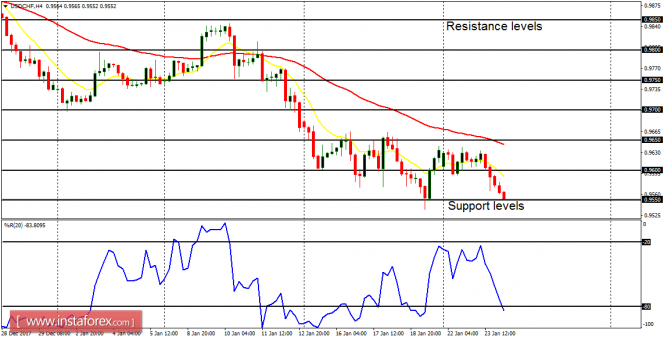
USD/CHF: The USD/CHF pair is trending downwards. It has gone downwards by 84 pips this week, and there is still much room to go downwards. Therefore, it is projected that the support levels at 0.9500, 0.9450, and 0.9400 would be reached within the next several trading days. Rallies in the market ought to be temporary.
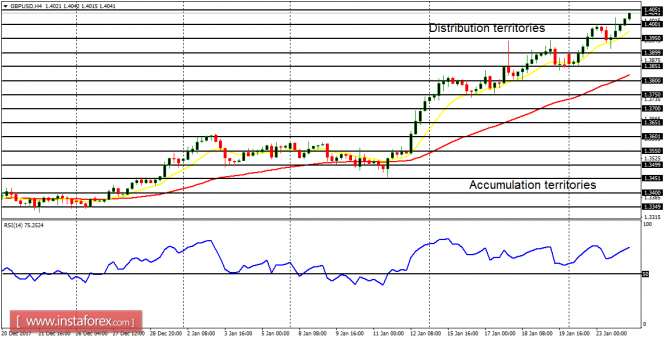
GBP/USD: The GBP/USD pair has continued to go upwards in a slow and steady manner. Minor bearish corrections have led to a further northward journey. Since price has gone upwards by 190 pips in this week alone, it is expected that it would go further upwards, reaching the distribution territories at 1.4050, 1.4100, and 1.4150.
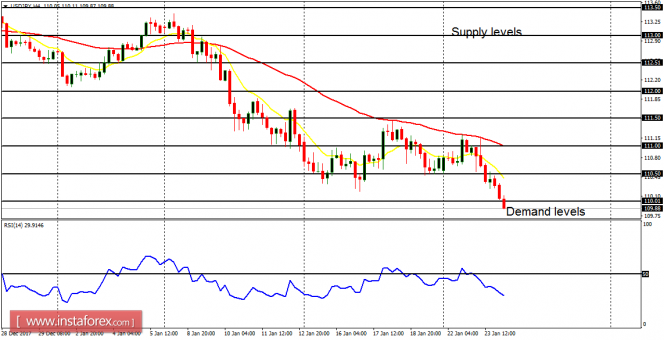
USD/JPY: This currency trading instrument is weak. Since the second week of January, the market has gone downwards by 330 pips, now below the supply level at 110.00. The EMA 11 is below the EMA 56, and the RSI period 14 is below the level 50. This is a bearish signal, which indicates more bearishness in the market.
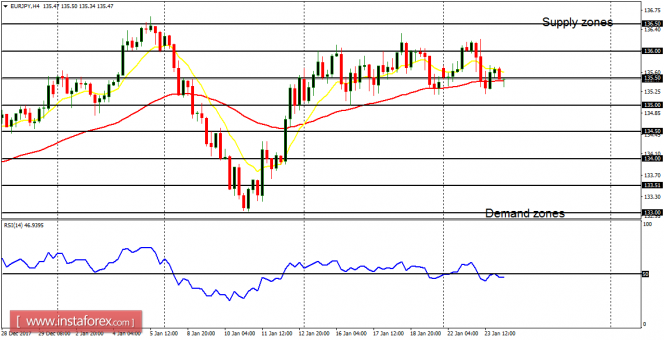
EUR/JPY: The EUR/JPY cross is essentially consolidating, oscillating between the supply zone at 136.50 and the demand zone at 135.00. The market is neutral in the short term, but bullish in the long term. The neutrality in the market could continue until a rise in volatility puts an end to it, resulting in a directional movement.