
Technical outlook:
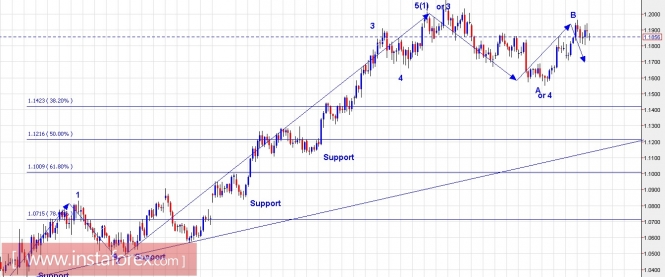
A daily chart view for EURUSD has been presented here to look at a bigger picture with the beginning of December series. At least 2 wave probabilities are coming up for now: Either the pair has completed 5 waves from 1.0350 lows since the beginning of 2017, or it has completed 3 waves to 1.2092 levels. In either scenario, a drop towards at least 1.1700 levels is looking highly probable. As discussed last week, the pair carved out a lower high at 1.1940 levels and reversed sharply. Even now, it is a good strategy to remain short with a soft target of 1.1700 levels going forward. Immediate price resistance is seen at 1.1960 levels, while support is seen around 1.1700 levels respectively. Shall review at 1.1700 levels if positions should be carried still lower or a bullish reversal is on cards.
Trading plan:
Please remain short for now with risk above 1.1960, the target is 1.1700 levels at least.
US Dollar Index chart setups:
Technical outlook:
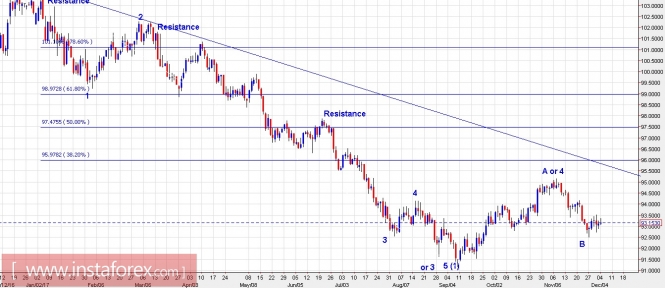
On the daily chart view presented here, the US Dollar Index is also offering at least two probable scenarios. The drop from 103.80 levels, since early 2017, has either unfolded into 5 waves or 3 waves. Giving benefit of doubt to both scenarios equally, we are prepared to trade the short/medium term structure. At present, the common point is that there should be a potential rally towards at least 94.20 levels before either reversing lower again or a continued rally. Please note that the Fibonacci co-relations suggest that the drop has unfolded into 3 waves and the current rally through 95.00 levels could be wave 4 of the same degree. Immediate price support is seen at 92.50 levels, while resistance is at 94.20 levels respectively.
Trading plan:
Please remain long for now, risk below 92.50 and target 94.20 levels.
Fundamental outlook:
Please watch out for USD ISM Non-Manufacturing/Services Composite (NOV) at 1000 AM EST
Good luck!
The material has been provided by InstaForex Company - www.instaforex.com