
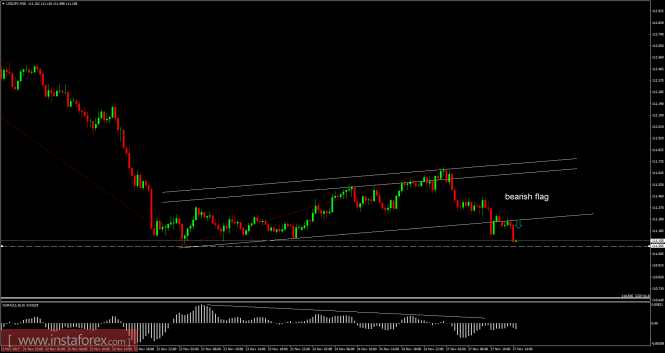
Recently, the USD/JPY pair has been trading downwards. The price tested the level of 111.09. According to the 30M time - frame, I found a broken bearish flag formation, which is a sign that sellers are in control. I also found a hidden bearish divergence on the moving average oscillator, which is another sign of weakness. The short-term trend is bearish. My advice is to watch for potential selling opportunities. The downward target is set at the price of 110.65 (Fibonacci expansion 61.8%). Key intraday support is set at the price of 111.06.
Resistance levels:
R1: 111.68
R2: 111.87
R3: 112.11
Support levels:
S1: 111.25
S2: 111.00
S3: 111.82
Trading recommendations for today: watch for potential selling opportunities.
The material has been provided by InstaForex Company - www.instaforex.com