
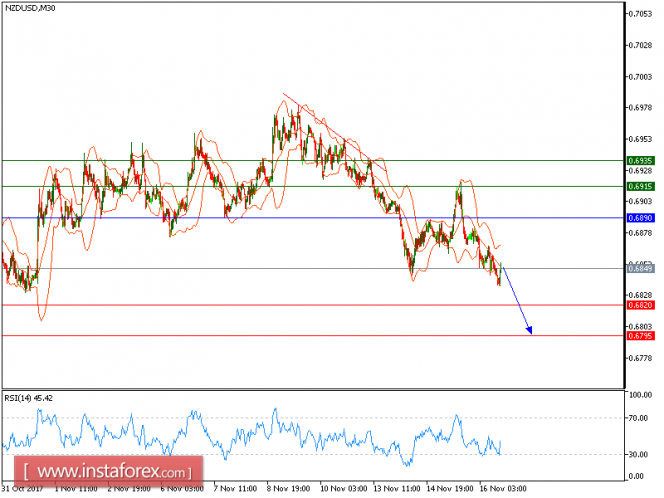
NZD/USD is under pressure. The pair posted some consolidations but is still under pressure below its nearest resistance at 0.6890. The 20-period moving average is turning down and has just crossed below the 50-period one. The relative strength index has broken below its neutrality area at 50.
To conclude, as long as 0.6890 is not surpassed, likely decline to 0.6820 and 0.6795 in extension.
The black line shows the pivot point. Currently, the price is above the pivot point, which indicates long positions. If it remains below the pivot point, it will indicate short positions. The red lines are showing the support levels and the green line is indicating the resistance levels. These levels can be used to enter and exit trades.
Resistance levels: 0.6915, 0.6935, and 0.6975
Support levels: 0.6820, 0.6795, and 0.6745
The material has been provided by InstaForex Company - www.instaforex.com