
Gold price re-tested the important resistance of $1,283-88 but got rejected once again. Despite Dollar's weakness, Gold did not break above the resistance. This was a bearish sign. The other bearish sign we noted yesterday was the form of the rise from $1,262 that was not an impulsive, but overlapping corrective structure. This increased the chances of a reversal.
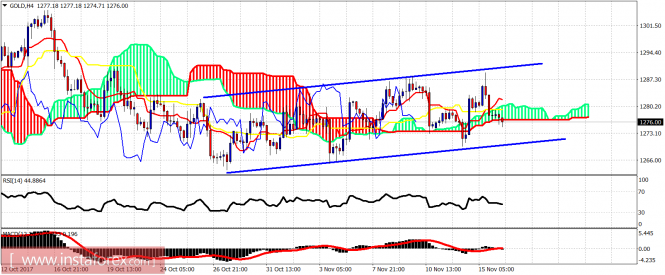
Gold price reached the upper channel boundary and got rejected. Price is now again below the 4-hour Kumo. Yesterday, we noted that despite price being above the 4-hour Kumo, trend was neutral as price was not making any progress to the upside. Price is still mainly moving sideways. If Dollar strengthens, I expect to see support at $1,262 get broken. This implies that we should fall towards $1,250-45.
Magenta line - resistance
Red line - short-term trend line resistance
Blue line -long-term trend line support
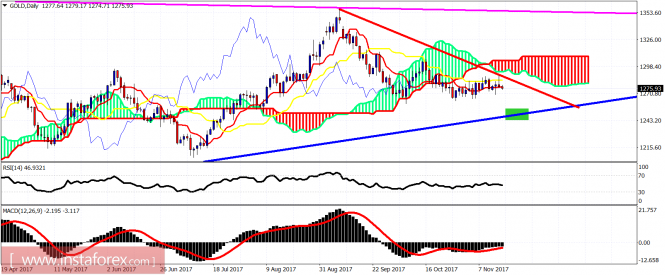
Gold price has broken again below the tenkan-sen in the daily chart as price got rejected once again at the kijun-sen. Trend remains bearish and Gold is heading towards the blue long-term upward sloping support trend line. There we should finally see an important low in Gold.
The material has been provided by InstaForex Company - www.instaforex.com