
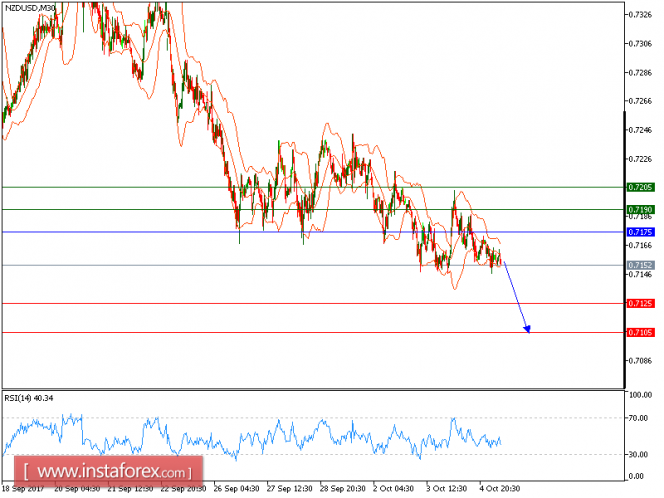
Our first target which we predicted in yesterday's analysis has been hit, capped by a downward trend line. The technical outlook of the pair is negative as the price has been capped by a bearish trend line since October 4. The 20-period moving average crossed below the 50-period one. The relative strength index is bearish and is calling for a further downside.
Therefore, below 0.7175, look for a new test with targets at 0.7125 and 0.7105 in extension.
The black line is showing the pivot point. Currently, the price is above the pivot point, which indicates long positions. If it remains below the pivot point, it will indicate short positions. The red lines are showing the support levels and the green line is indicating the resistance levels. These levels can be used to enter and exit trades.
Resistance levels: 0.7190, 0.7205, and 0.7245
Support levels: 0.7125, 0.7105, and 0.7070
The material has been provided by InstaForex Company - www.instaforex.com