
The pair is looking for catalysts as it remains trapped in a consolidative phase. The 200 SMA is still guiding the path and one could expect more declines to take place. If that happens, GBP/USD should break below the support zone of 1.3209 in order to extend the bearish tone towards the 1.3121 level. MACD indicator is entering neutral territory.
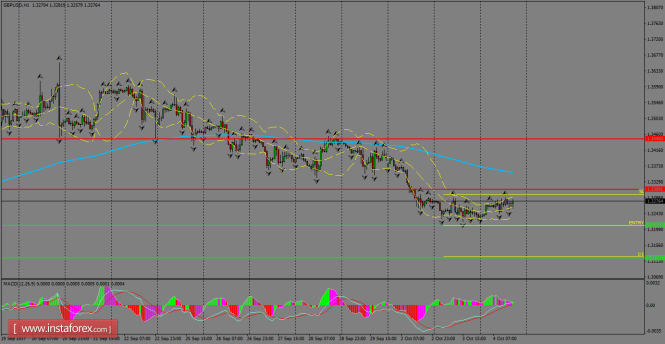
H1 chart's resistance levels: 1.3309 / 1.3446
H1 chart's support levels: 1.3209 / 1.3121
Trading recommendations for today: Based on the H1 chart, sell (short) orders only if the GBP/USD pair breaks a bearish candlestick; the support level is at 1.3209, take profit is at 1.3121 and stop loss is at 1.3294.
The material has been provided by InstaForex Company - www.instaforex.com