
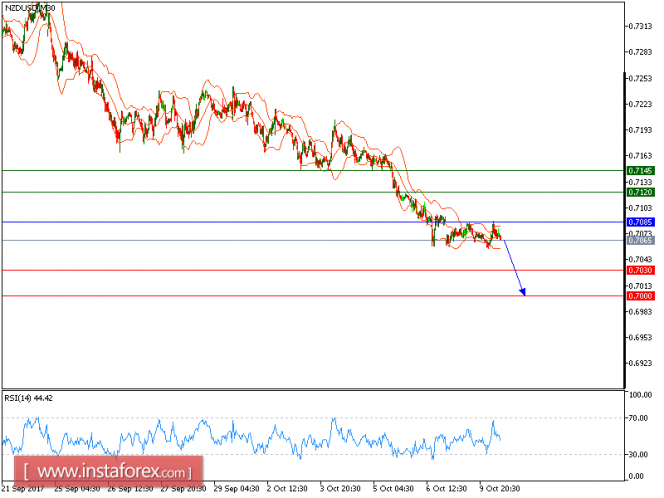
NZD/USD is under pressure and expected to continue the downside movement. The pair is under pressure below the key resistance at 0.7085 (the high of Oct. 9). The downward momentum is further reinforced by both declining 20-period and 50-period moving averages. The relative strength index is bearish and calls for another downside.
To sum up, as long as 0.7085 is not surpassed, look for a new test with targets at 0.7030 and 0.7000 in extension.
The black line is showing the pivot point. Currently, the price is above the pivot point, which indicates long positions. If it remains below the pivot point, it will indicate short positions. The red lines are showing the support levels and the green line is indicating the resistance levels. These levels can be used to enter and exit trades.
Resistance levels: 0.7120, 0.7145, and 0.7170
Support levels: 0.7030, 0.7000, and 0.6955
The material has been provided by InstaForex Company - www.instaforex.com