
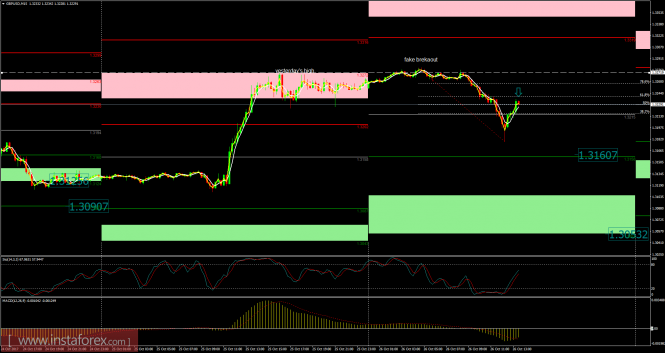
Recently, the GBP/USD has been trading upwards. The price tested the level 1.3278. Anyway, according to the 15M time – frame, I found a fake breakout of yesterday's high at the price of 1.3270, which is a sign that buying looks risky. There is also a testing of intraday Fibonacci retracement 61.8% at the price of 1.3238, which is another sign of weakness. My advice is to watch for potential selling opportunities. The downward targets are set at the price of 1.3160 (S1) and 1.3055 (S2, extreme intraday target).
Resistance levels:
R1: 1.3319
R2: 1.3376
R3: 1.3480
Support levels:
S1: 1.3160
S2: 1.3055
S3: 1.2995
Trading recommendations for today: watch for potential selling opportunities.
The material has been provided by InstaForex Company - www.instaforex.com