
As expected, the US dollar index pulled back off the 94 resistance area towards the short-term support of 93.50 as we mentioned in yesterday's analysis. The trend remains bullish as the price is still above cloud support and inside the bullish channel.
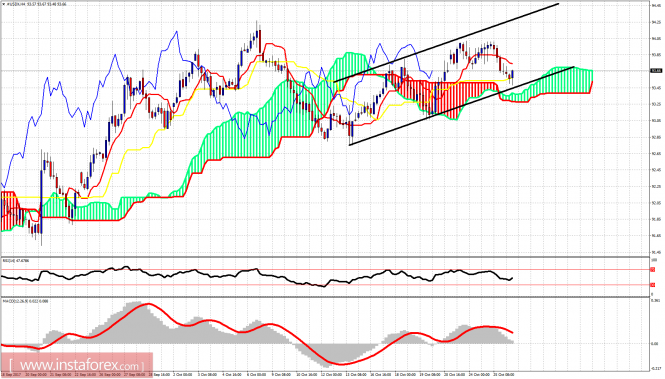
Black lines - bullish channel
The dollar index is trading inside the bullish channel. The support is found at 93.50 and the resistance lies at 94. Breaking above the resistance will open the way for a move towards 94.30-94.50. As long as the price is above 93.50 the trend is bullish.
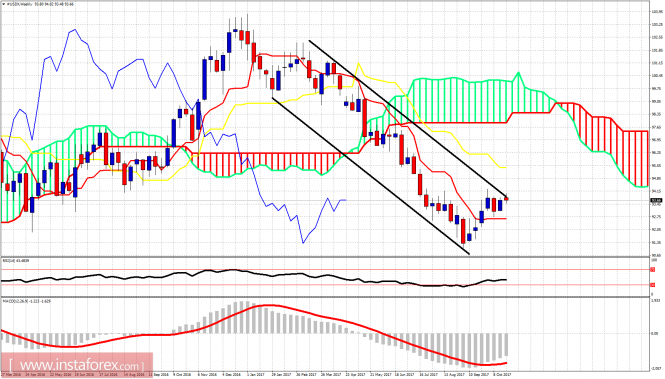
On a weekly basis the Dollar index remains inside the bearish channel and shows signs of rejection at the upper channel boundary. Breaking above 94 will probably push the price towards the weekly kijun-sen (yellow line indicator) at 95.45. Short-term trend remains bullish but we could see its end today if we break 93.50. Until then trend is bullish targeting 95.
The material has been provided by InstaForex Company - www.instaforex.com