MG Network

something big isHappening!

In the mean time you can connect with us with via:

Copyright © Money Grows Network | Theme By Gooyaabi Templates

Money Grows Network

Archive

Powered by Blogger.

Welcome To Money Grows Network

Verified By

2006 - 2019 © www.moneygrows.net

Investments in financial products are subject to market risk. Some financial products, such as currency exchange, are highly speculative and any investment should only be done with risk capital. Prices rise and fall and past performance is no assurance of future performance. This website is an information site only.

Popular

Pages

Expert In

Name*


Message*

GBP/USD analysis for October 16, 2017

analytics59e49b539eb2f.png

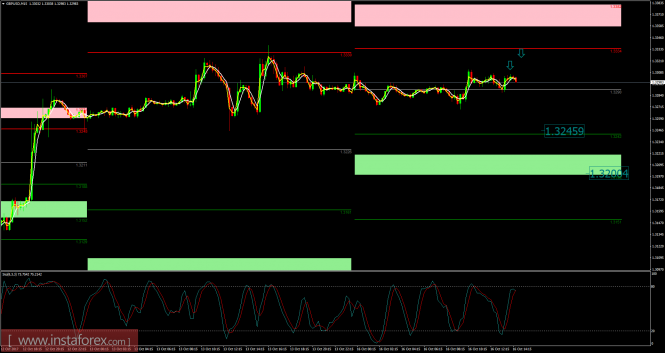
Recently, the GBP/USD pair has been trading sideways at the price of 1.3300. According to the 15M time - frame, I found doji candles and bearish enguling pattern around the pivot point (1.3290), which is a sign that a buying looks risky. There is an overbought stochastic oscilator, which is another sign of weakness. My advice is to watch for potential selling opportunties. The downward targets are set at the price of 1.3245 (S1) and the price of 1.3200 (S2)

Resistance levels:

R1: 1.3335

R2: 1.3382

R3: 1.3425

Support levels:

S1: 1.3245

S2: 1.3200

S3: 1.3150

Trading recommendations for today: watch for potential selling opportunities.

The material has been provided by InstaForex Company - www.instaforex.com