MG Network

something big isHappening!

In the mean time you can connect with us with via:

Copyright © Money Grows Network | Theme By Gooyaabi Templates

Money Grows Network

Archive

Powered by Blogger.

Welcome To Money Grows Network

Verified By

2006 - 2019 © www.moneygrows.net

Investments in financial products are subject to market risk. Some financial products, such as currency exchange, are highly speculative and any investment should only be done with risk capital. Prices rise and fall and past performance is no assurance of future performance. This website is an information site only.

Popular

Pages

Expert In

Name*


Message*

Ichimoku indicator analysis of USDX for October 16, 2017

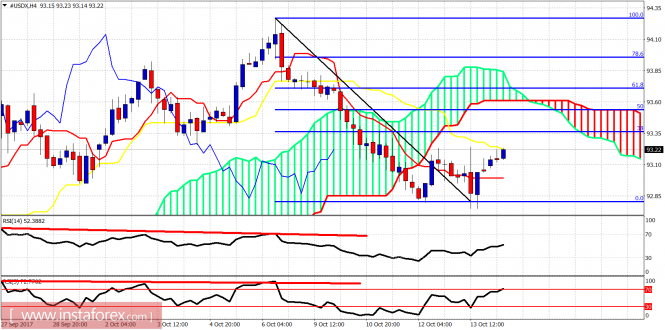
The Dollar index has not managed yet to make a correction up to the 38% Fibonacci retracement. Price is below the Kumo (cloud) implying weakness and inability to bounce harder.

analytics59e45adb38c1f.png

The Dollar index is trading between the kijun- and the tenkan-sen. Price is below the Kumo (cloud) in the 4-hour chart. Trend is bearish and expect the downward move to resume once this corrective bounce is over. The Dollar index support is at 92.60 and resistance at 93.35.

analytics59e45b2171e55.png

Black lines - bearish channel

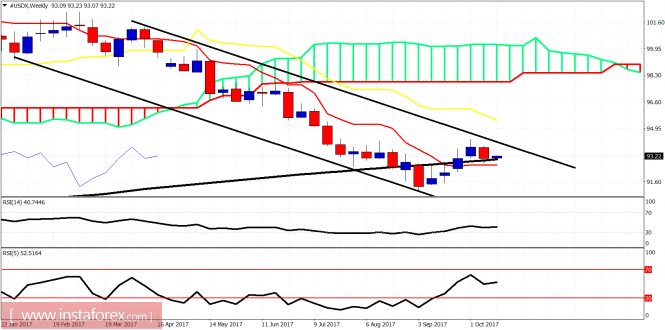
On a weekly basis, trend remains bearish. Support is at 92.60. A weekly close below 92.60 will open the way towards 90 or lower. Even a daily close below 92.60 would be an equally important bearish sign. I believe a medium-term top was made around 94 and we have started the final leg down.

The material has been provided by InstaForex Company - www.instaforex.com