MG Network

something big isHappening!

In the mean time you can connect with us with via:

Copyright © Money Grows Network | Theme By Gooyaabi Templates

Money Grows Network

Archive

Powered by Blogger.

Welcome To Money Grows Network

Verified By

2006 - 2019 © www.moneygrows.net

Investments in financial products are subject to market risk. Some financial products, such as currency exchange, are highly speculative and any investment should only be done with risk capital. Prices rise and fall and past performance is no assurance of future performance. This website is an information site only.

Popular

Pages

Expert In

Name*


Message*

Ichimoku indicator analysis of USDX for September 5, 2017

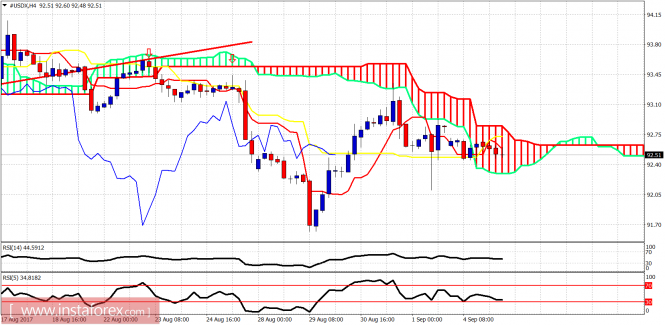
Not much action was seen yesterday due to the US holiday. The US dollar index is moving sideways between 92.85 and 92.30. Daily trend remains bearish. A new lower low is expected before a bigger bounce.

analytics59ae50dc6e72a.png

Price is moving lower but has entered the Ichimoku cloud on the 4 hour chart. Breaking above the cloud will open the way for a push higher towards 93.50. Support is found at 92.30. Breaking it will open the way for a push to new lows.

analytics59ae51185c361.png

Red lines - bearish channel

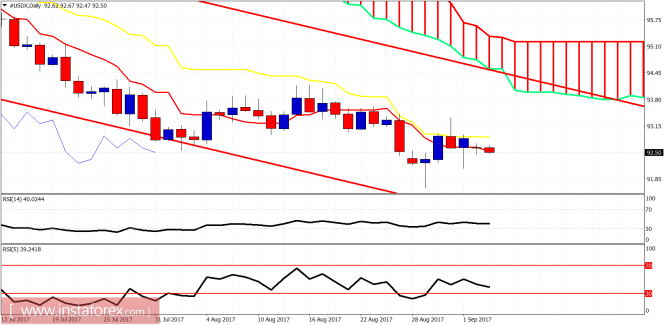
The US dollar index daily chart is not looking good as the price cannot break above the kijun-sen (yellow line indicator) and is now breaking below the tenkan-sen (red line indicator). This is a bearish sign. Trend remains bearish on a daily basis as long as price is below 95.10. A bounce towards 94-95 is expected once we make one more new low around 90.

The material has been provided by InstaForex Company - www.instaforex.com