
The pair still remains within a narrow range established below the resistance level of 1.3592 across the board and looks to test the 200 SMA at H1 chart. Fractals have been formed during retracement and if GBP/USD manages to rebound above the 200 SMA, we can expect further gains to reach the next key target around 1.3755. MACD indicator is still in the negative territory, favoring to more declines.
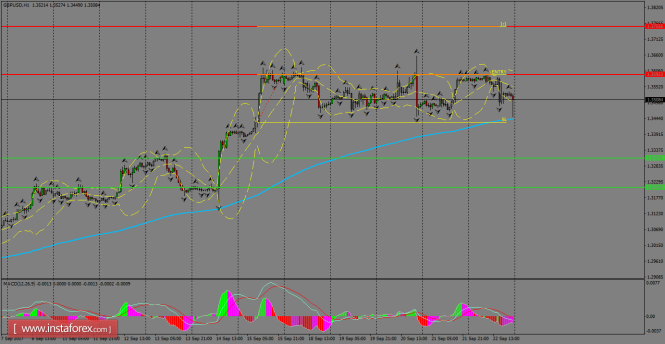
H1 chart's resistance levels: 1.3592 / 1.3755
H1 chart's support levels: 1.3309 / 1.3209
Trading recommendations for today: Based on the H1 chart, buy (long) orders only if the GBP/USD pair breaks a bullish candlestick; the resistance level is at 1.3592, take profit is at 1.3755 and stop loss is at 1.3430.
The material has been provided by InstaForex Company - www.instaforex.com