Trading plan for 21/08/2017:
On Monday 21st of August, the event calendar is light in important data releases. Only during the US session, the global investors will focus on Wholesale Sales data from Canada.
USD/CAD analysis for 21/08/2017:
The Wholesale Sales data are scheduled for release at 12:30 pm GMT and market participants expect the value of sales to decrease from 0.9% last month to 0.6% in the reported month. Wholesalers sell to industries and retailers in quantities far larger than most consumers are willing to purchase. Given that growth in Wholesale Trade usually precedes increases in retail trade and consumption, changes in Wholesale Sales can be used as an early indicator for the overall direction of the retail sector, consumption, and the economy. Last month, the Bank of Canada decided to hike the interest rate from 0.5% to 0.75%, which was the first rate hike since 2010. More importantly, the BoC did not close the road for further tightening. In the current situation, the low unemployment rate, high GDP projections (if the Wholesale Sales data will beat the expectations) and the inflationary pressures are supporting the Bank of Canada's intention for one more rate hike in October.
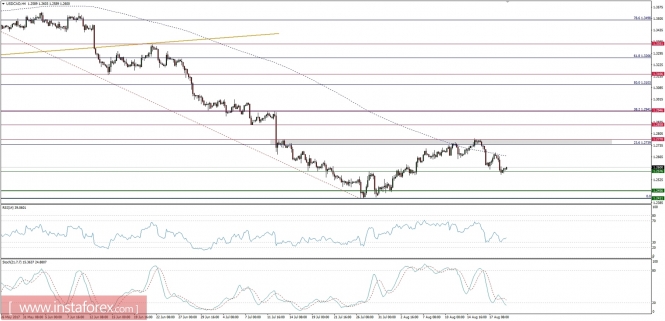
Let's now take a look at the USD/CAD technical picture at the H4 time frame. Bulls have managed to retrace 23% of the previous swing down and were stopped at the level of 1.2770. Then the market reversed and tested the technical support at the level of 1.2576. The question remains, whether this was just a dead cat bounce that will lead to another lower low or the beginning of some more substantial correction. The next technical resistance is seen at the level of 1.2858 and 38%Fibo is seen at the level fof 1.2941. The market conditions look oversold with a visible bullish divergence at the momentum indicator. The bias is slightly bullish (as long as no new low is made).
Market Snapshot: Gold rejected at $1296 resistance
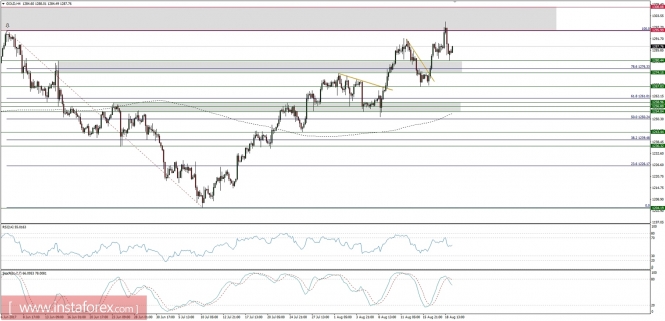
The price of gold has broken through the important technical resistance at the level of $1,296 but got immediately rejected and tested the previous support at the level of $1,280. The market conditions are overbought and there is a visible bearish divergence between the price and the momentum oscillator, which supports the downside bias. The next technical support is seen at the levels of $1,274 and $1,267.
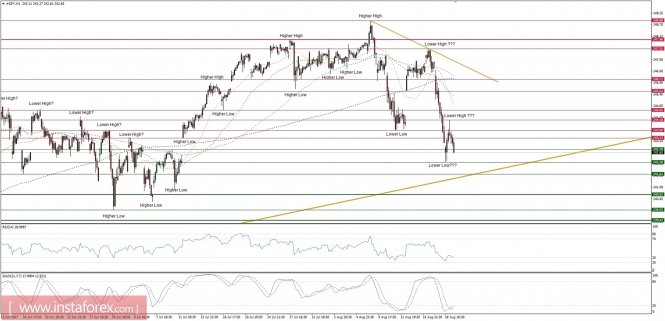
Market Snapshot: SPY fills the gap
After filling the gap between the levels of 242.16 - 243.31, the SPY ( SP500 ETF) tried to rally higher, but was rejected at the level of 244.18 and the shooting star candlestick formation was made at an hourly time-frame chart. Since then, the price dropped towards the lows and it is getting close to the golden trend line dynamic support around the level of 241.61.