
The index had a bearish journey on Friday and remains supported by the 93.28 level. Overall, the greenback is hovering around the 200 SMA at H1 chart and it's looking for a clear path in the short term. However, as long as it doesn't form any other lower low pattern, USDX could rally to test the resistance level of 94.11.
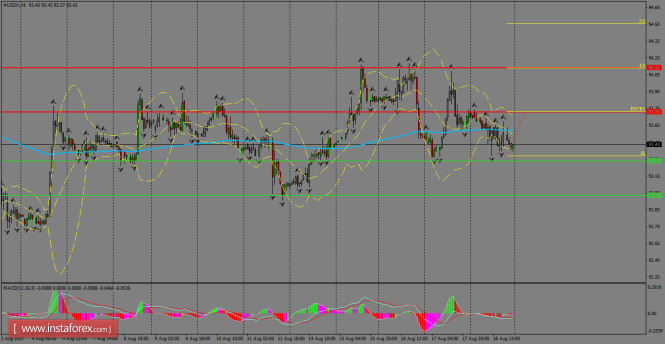
H1 chart's resistance levels: 93.72 / 94.11
H1 chart's support levels: 93.28 / 92.97
Trading recommendations for today: Based on the H1 chart, place buy (long) orders only if the USD Index breaks with a bullish candlestick; the resistance level is at 93.72, take profit is at 94.11 and stop loss is found at 93.33.
The material has been provided by InstaForex Company - www.instaforex.com