
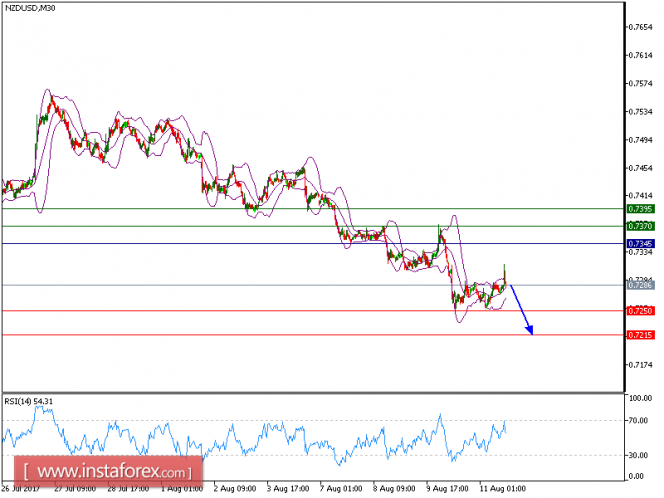
NZD/USD is still under pressure and expected to trade in lower range. The pair is consolidating below its key resistance at 0.7345. The declining 50-period moving average plays a resistance role. The relative strength index is bearish and calls for a new drop.
Hence, as long as 0.7345 holds on the upside, we expect a further decline to 0.7250 and even to 0.7215 in extension.
Chart Explanation:
The black line shows the pivot point. Currently, the price is above the pivot point which indicates the bullish position. If it remains below the pivot point, it will indicate the short position. The red lines show the support levels and the green line indicates the resistance levels. These levels can be used to enter and exit trades.
Resistance levels: 0.7370, 0.7395, and 0.7425
Support levels: 0.7250, 0.7215, and 0.7180
The material has been provided by InstaForex Company - www.instaforex.com