
Overview:
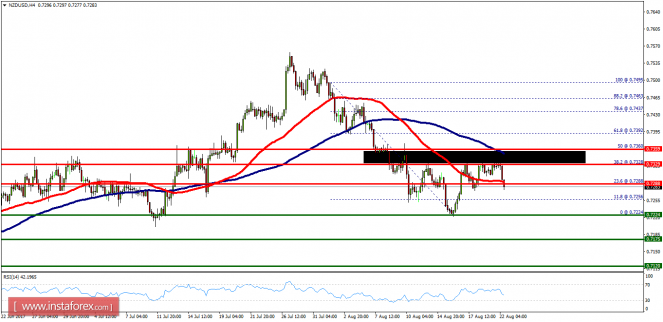
- The NZD/USD pair still is moving towards the resistance area of 0.7329-0.7360 in order to fall again from the level of 0.7329 (this level coincides with the ratio of 38.2%).
- Usually, history repeats itself. However, the first resistance level is seen at 0.7288 followed by 0.7328 and 0.7360, while daily support 1 is found at 0.7175.
- According to the previous events, the NZD/USD pair is still moving between the levels of 0.7288 and 0.7175; hence, we expect a range of 113 pips.
- If the NZD/USD pair fails to break through the resistance level of 0.7288, the market will decline further to 0.7175. This would suggest a bearish market because the RSI indicator is still in a positive area and does not show any trend-reversal signs.
- The pair is expected to drop lower towards at least 0.7175 with a view to testing the daily support 1.
- Contrariwise, if a breakout takes place at the resistance level of 0.7329, then this scenario may become invalid. Therefore, we still expect the bearish market as long as the trend is below the price of 0.7359 (R3).