
Gold price could not break above the resistance at $1,300 yesterday and is turning lower. The corrective phase in gold may be not over yet, so we could see lower price levels again. Weekly support and important for the medium-term trend is at $1,247.
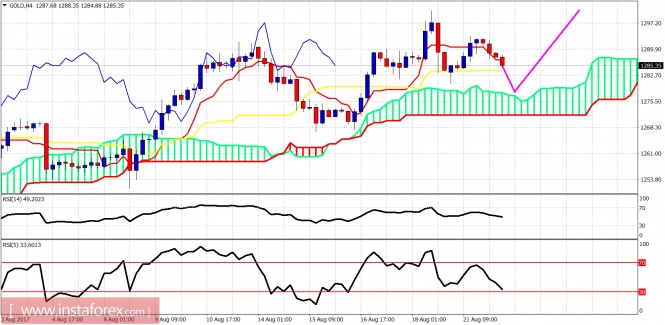
The short-term support is at $1,282. If broken, we should expect gold price to move towards the 4 hour Kumo (cloud) at $1,275 and bounce strongly from that level. Overall, a move lower in gold prices is not a bearish signal for me but a buying opportunity.
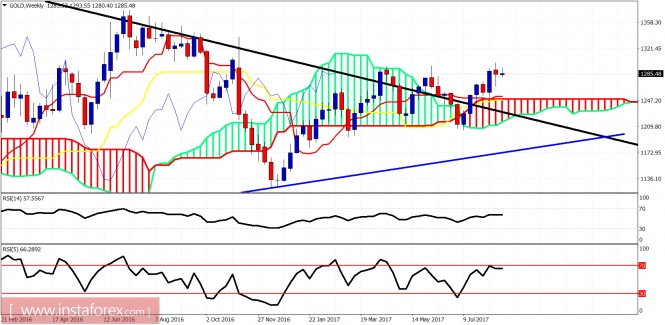
Blue line - long-term support
Price has broken the long-term trend line resistance and is trading above the weekly Kumo. The weekly support is found at $1,247. A pullback towards $1,250 is not out of the question and it would be a gift for gold bulls. We remain bullish on gold in the longer term.
The material has been provided by InstaForex Company - www.instaforex.com