MG Network

something big isHappening!

In the mean time you can connect with us with via:

Copyright © Money Grows Network | Theme By Gooyaabi Templates

Money Grows Network

Archive

Powered by Blogger.

Welcome To Money Grows Network

Verified By

2006 - 2019 © www.moneygrows.net

Investments in financial products are subject to market risk. Some financial products, such as currency exchange, are highly speculative and any investment should only be done with risk capital. Prices rise and fall and past performance is no assurance of future performance. This website is an information site only.

Popular

Pages

Expert In

Name*


Message*

Ichimoku indicator analysis of USDX for August 29, 2017

The Dollar as expected is heading towards 91.60 which was our target for the last couple of weeks. We posted an analysis right on time when the bullish channel and the consolidation were broken downwards and a new sell signal was given. Since then we target 91.60.

analytics59a5192c5a660.png

The price is below both the tenkan- and kijun-sen. The short-term trend is clearly bearish, as the price is making lower lows and lower highs. Oscillators are making new lows and there is no sign of a divergence yet. Resistance is at 92.30 and next at 92.75.

analytics59a5196ed083a.png

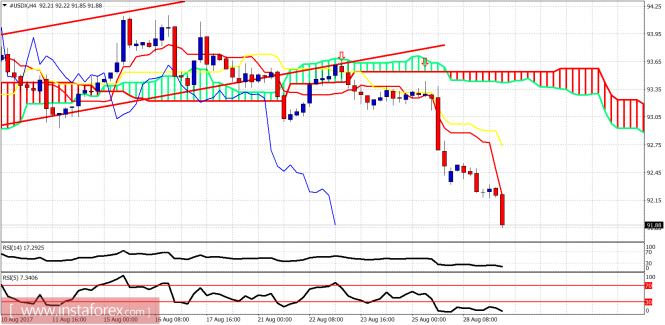
Red lines - bearish channel

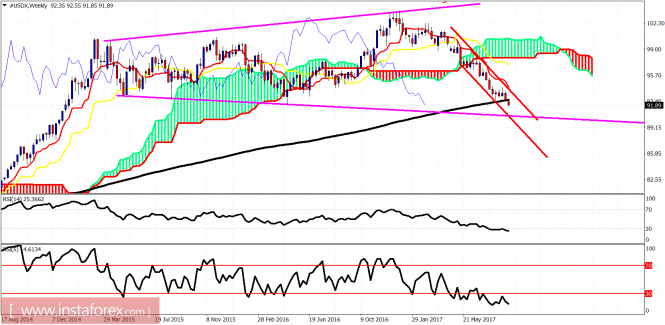
Purple lines - expanding triangle pattern

The Dollar index remains in a bearish trend confirmed once the weekly candles broke below the weekly Kumo. The price has now broken below the 200 MA and is heading towards the lower boundary of the expanding triangle pattern. This target is around 90.70-90, depending on the time it will take to move towards the purple line. Once we get there, we see how strong of a support and pattern this will be. Weekly resistance is at 93.50. Breaking above it will start a strong bounce that could push the index back towards 95-96.

The material has been provided by InstaForex Company - www.instaforex.com