
The sideways range made a come back to the GBP/USD pair's structure, as it holds the support zone of 1.2850. Overall outlook remains bearish as long as the pair stays below the 200 SMA at H1 chart, but it seems that bears are starting to lose some steam. However, if it manages to break below 1.2850, then it can plummet towards 1.2761.
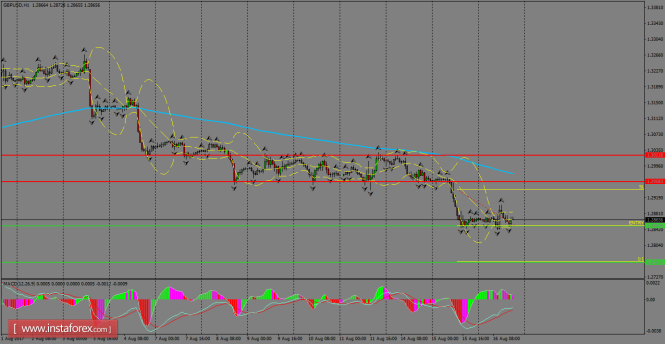
H1 chart's resistance levels: 1.2958 / 1.3021
H1 chart's support levels: 1.2850 / 1.2761
Trading recommendations for today: Based on the H1 chart, sell (short) orders only if the GBP/USD pair breaks a bearish candlestick; the support level is at 1.2850, take profit is at 1.2761 and stop loss is at 1.2938.
The material has been provided by InstaForex Company - www.instaforex.com