
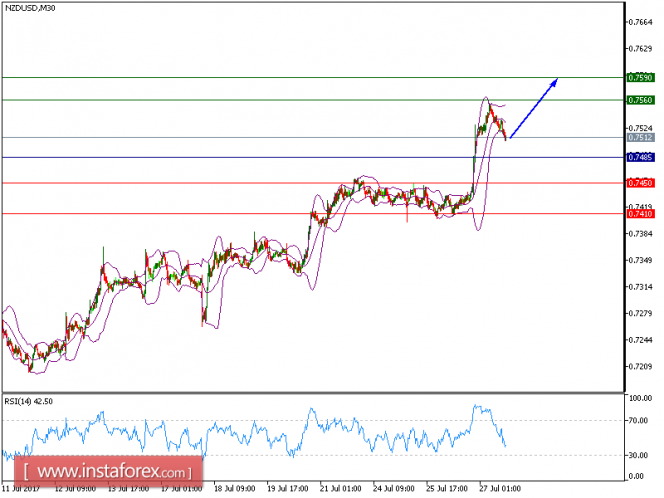
NZD/USD is expected to trade in higher range and continue its upside movement. The pair accelerated to the upside after breaking above the declining trend line since July 21. The upward momentum is further reinforced by both rising 20-period and 50-period moving averages. The relative strength index is bullish and calls for a further rise.
To sum up, as long as the price holds above 0.7485, look for a new challenge to 0.7560 and even to 0.7590 in extension.
Strategy: BUY Stop Loss: 0.7485 Take Profit: 0.7560
Chart Explanation:
The black line shows the pivot point. Currently, the price is above the pivot point which indicates the bullish position. If it remains below the pivot point, it will indicate the short position. The red lines show the support levels and the green line indicates the resistance levels. These levels can be used to enter and exit trades.
Resistance levels: 0.7560, 0.7590, and 0.7630
Support levels: 0.7450, 0.7410, and 0.7380
The material has been provided by InstaForex Company - www.instaforex.com