
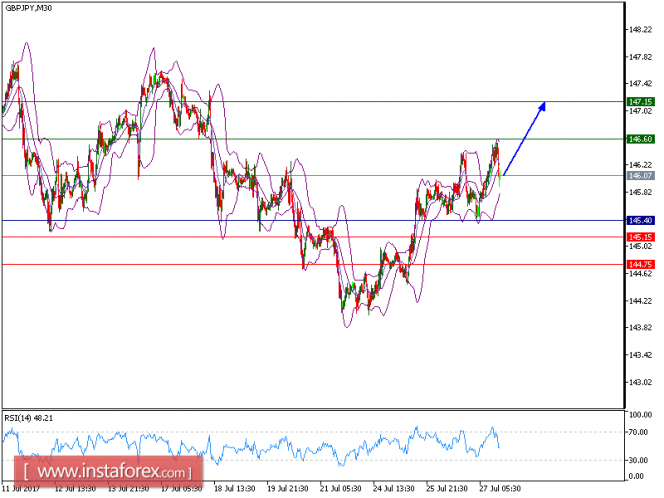
Our targets which we predicted yesterday have been hit. The pair has bounced from another support at 145.40 and is holding on the upside. The rising 50-period moving average is playing a support role and maintains the upside bias. The relative strength index is above its neutrality level at 50 and lacks downward momentum. In addition, 130.20 is playing a key support role, which should limit the downside potential.
As long as this key level holds on the downside, look for a further advance towards 146.60 and even 147.15 in extension.
Alternatively, if the price moves in the opposite direction as predicted, a short position is recommended below 145.40 with the target at 145.15.
Strategy: BUY, Stop Loss: 145.40, Take Profit: 146.60.
Chart Explanation: the black line shows the pivot point. The price above pivot point indicates the bullish position and when it is below pivot points, it indicates a short position. The red lines show the support levels and the green line indicates the resistance levels. These levels can be used to enter and exit trades.
Resistance levels: 146.60, 147.15, and 148.00
Support levels: 145.15, 144.75, and 144.15.
The material has been provided by InstaForex Company - www.instaforex.com