
Gold price remains inside the bearish channel and below the Ichimoku cloud. Trend remains bearish. However yesterday's bounce from $1,205 towards $1,220 is the first sign of a possible reversal. Bears need to be very careful. A break above $1,230 will confirm a trend reversal.
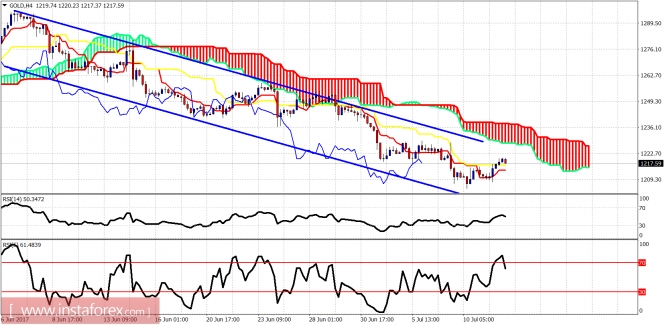
Short-term resistance by the cloud and the bearish channel is found at $1,227-35. Support is at $1,210-$1,205. Gold price has started making higher highs and higher lows in the 4-hour chart. However confirmation of a major low will come with the break above $1,235.
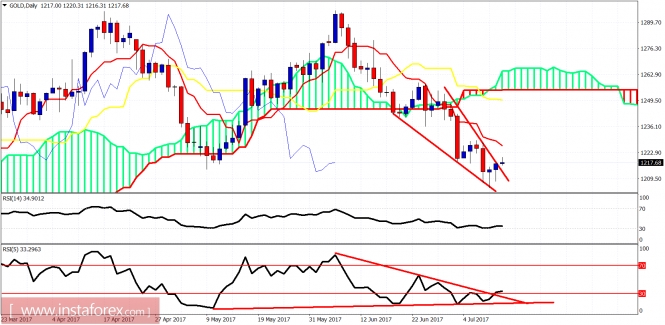
Gold price has broken above and out of the downward sloping wedge pattern. The RSI (5) has also broken the wedge pattern. This implies that a bounce towards the start of the wedge at $1,260 is the minimum expectation for Gold price.
The material has been provided by InstaForex Company - www.instaforex.com