
Our target which we predicted in yesterday's analysis has been hit. GBP/JPY is still under pressure. The pair is rebounding and has broken above its declining 20-period moving average.
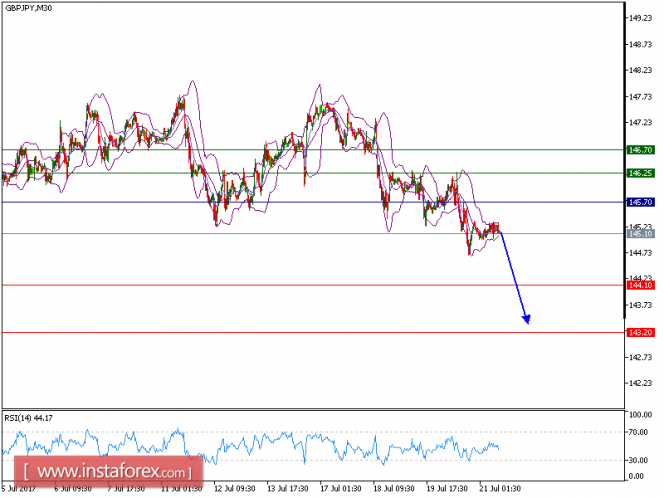
The relative strength index is above its neutrality level at 50. Nevertheless, 145.70 is playing a key resistance role, which should limit the upside potential.
As long as 145.70 holds on the upside, expect a return to 144.10. A break below this level would call for a further decline towards 143.20.
Alternatively, if the price moves in the opposite direction as predicted, a long position is recommended above 145.70 with the target at 146.25.
Chart Explanation: the black line shows the pivot point. The price above pivot point indicates the bullish position and when it is below pivot points, it indicates a short position. The red lines show the support levels and the green line indicates the resistance levels. These levels can be used to enter and exit trades.
Strategy: SELL, Stop Loss: 145.70, Take Profit: 144.10.
Resistance levels: 146.25, 146.70, and 147.15
Support levels: 144.10, 143.20, and 142.45.
The material has been provided by InstaForex Company - www.instaforex.com