
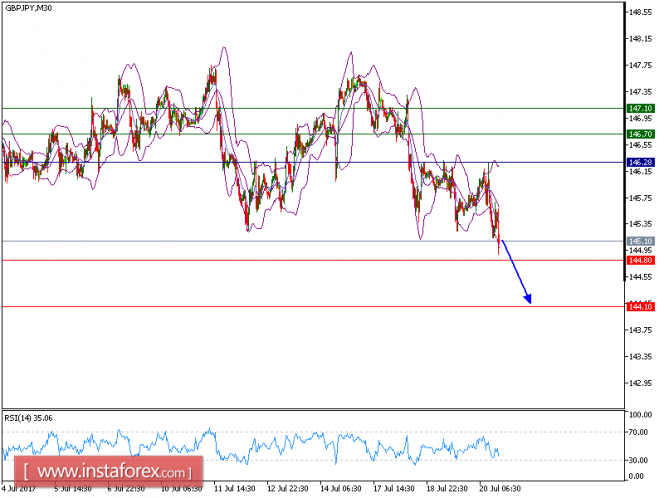
As predicted, our downside target has been hit. The pair recorded a succession of lower highs and lower lows since July 18, which confirms a negative scenario. The declining 50-period moving average is playing a resistance role and maintains the downside bias. The relative strength index is capped by a bearish trend line.
As long as 146.325 holds on the upside, look for a further drop towards 144.80 and even 144.10 in extension.
Alternatively, if the price moves in the opposite direction as predicted, a long position is recommended above 146.30 with the target at 144.80.
Chart Explanation: the black line shows the pivot point. The price above pivot point indicates the bullish position and when it is below pivot points, it indicates a short position. The red lines show the support levels and the green line indicates the resistance levels. These levels can be used to enter and exit trades.
Strategy: SELL, Stop Loss: 146.28, Take Profit: 144.80.
Resistance levels: 146.70, 147.10, and 147.85
Support levels: 144.80, 144.10, and 143.45.
The material has been provided by InstaForex Company - www.instaforex.com