
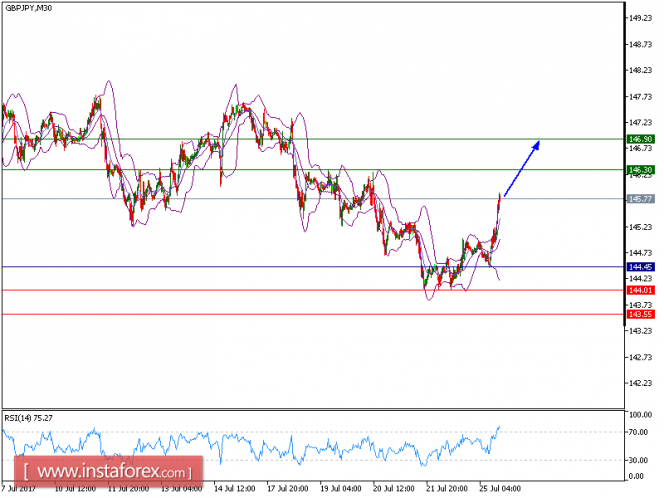
GBP/JPY is expected to trade in a higher range. The pair is rebounding and is trading above the rising 20-period moving average, which is playing a support role. In addition, the 20-period moving average just crossed above the 50-period one, which is a positive signal. It is still supported by a rising 50-period moving average.
A support base at 144.45 has formed and has allowed for a temporary stabilization. To sum up, as long as this key level is not broken, look for a further upside to 146.30 and even to 146.90 in extension.
Alternatively, if the price moves in the opposite direction as predicted, a short position is recommended below 144.45 with the target at 141.00.
Strategy: BUY, Stop Loss: 144.45, Take Profit: 14.55.
Chart Explanation: the black line shows the pivot point. The price above pivot point indicates the bullish position and when it is below pivot points, it indicates a short position. The red lines show the support levels and the green line indicates the resistance levels. These levels can be used to enter and exit trades.
Resistance levels: 146.30, 146.90, and 147.60
Support levels: 144.00, 143.55, and 143.00.
The material has been provided by InstaForex Company - www.instaforex.com