
GBP/JPY is expected to trade with a bullish bias. The pair is currently testing the support of its 50-period moving average, and remains above the horizontal support at 127.80. The 20-period moving average still remains above the 50-period moving average, and the relative strength index is around its neutrality area at 50, lacking downward momentum.
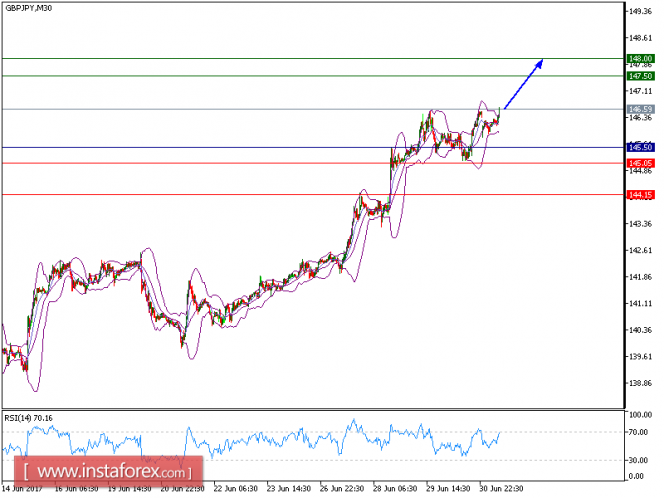
As long as 145.50 is not broken down, further advance is preferred with 147.50 and 148.00 as targets.
Alternatively, if the price moves in the opposite direction as predicted, a short position is recommended below 145.50 with the target at 145.05.
Chart Explanation: the black line shows the pivot point. The price above pivot point indicates the bullish position and when it is below pivot points, it indicates a short position. The red lines show the support levels and the green line indicates the resistance levels. These levels can be used to enter and exit trades.
Strategy: BUY, Stop Loss: 145.40, Take Profit: 147.50.
Resistance levels: 147.50, 148.00, and 148.50
Support levels: 145.05, 144.15, and 143.15
The material has been provided by InstaForex Company - www.instaforex.com