
A thin liquidity day we had in the markets and the GBP/USD pair didn't have much action during Monday. An ongoing consolidation below the 200 SMA is taking place and one could expect a kind of breakout below Monday's lows in order to test the 1.2756 level as the next support to the downside. MACD indicator remains in favor of the bullish bias.
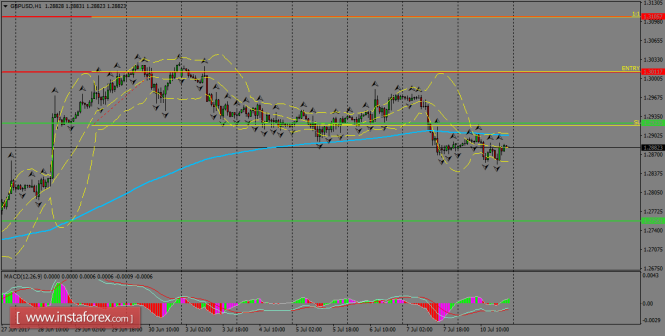
H1 chart's resistance levels: 1.3011 / 1.3105
H1 chart's support levels: 1.2923 / 1.2756
Trading recommendations for today: Based on the H1 chart, buy (long) orders only if the GBP/USD pair breaks a bullish candlestick; the resistance level is at 1.3011, take profit is at 1.3105 and stop loss is at 1.2918.
The material has been provided by InstaForex Company - www.instaforex.com