
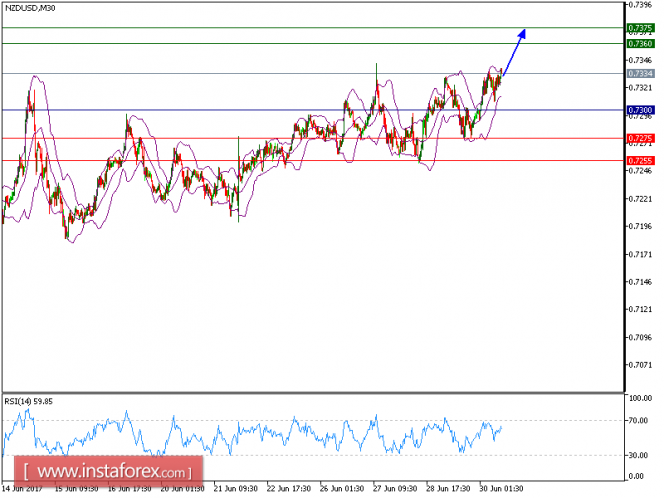
NZD/USD is expected to trade in a higher range as there is possibility of a trend change. The pair posted a rebound from 0.7275 (the low of June 29) and broke above both 20-period and 50-period moving averages. In addition, the 20-period moving average is turning up. The relative strength index has just landed on its neutrality level at 50 and is turning up.
To sum up, above 0.7300, expect a continuation of rebound to 0.7360 and even to 0.7375 in extension.
Strategy: BUY Stop Loss: 0.7300. Take Profit: 0.7360
Chart Explanation: The black line shows the pivot point. Currently, the price is above the pivot point which indicates the bullish position. If it is below the pivot points, it indicates the short position. The red lines show the support levels and the green line indicates the resistance levels. These levels can be used to enter and exit trades.
Resistance levels: 0.7360, 0.7375, and 0.7405
Support levels: 0.7275, 0.7255, and 0.7200
The material has been provided by InstaForex Company - www.instaforex.com