
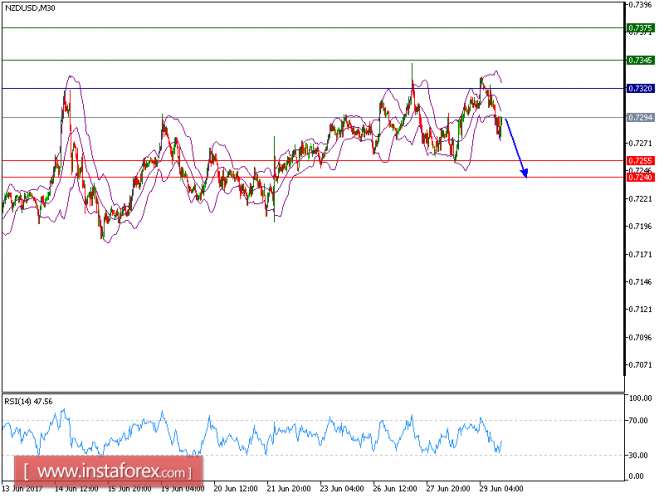
NZD/USD is expected to continue trading in a lower range and we will keep our yesterday's target intact. The pair recorded lower tops and lower bottoms, which confirmed the negative outlook. The downward momentum is further reinforced by the declining 20-period and 50-period moving averages. The relative strength index is capped by the bearish trend line.
Hence, as long as 1.3075 is not surpassed, expect a further downside to 0.7255 and even to 0.7240 in extension.
Strategy: SELL Stop Loss: 0.7320. Take Profit: 0.7255
Chart Explanation: The black line shows the pivot point. Currently, the price is above the pivot point which indicates the bullish position. If it is below the pivot points, it indicates the short position. The red lines show the support levels and the green line indicates the resistance levels. These levels can be used to enter and exit trades.
Resistance levels: 0.7355, 0.7375, and 0.7405
Support levels: 0.7255, 0.7240, and 0.7200
The material has been provided by InstaForex Company - www.instaforex.com