
NZD/USD is expected to trade with a bullish bias above 0.7110. Although the pair retreated from 0.7150 (the high of June 5), it is still trading above the key support at 0.7110 (the low of June 5), which should limit the downside potential. Even though a continuation of the consolidation cannot be ruled out, its extent should be limited.
Therefore, as long as 0.7110 is not broken, look for a further rise to 0.7195 and even to 0.7220 in extension.
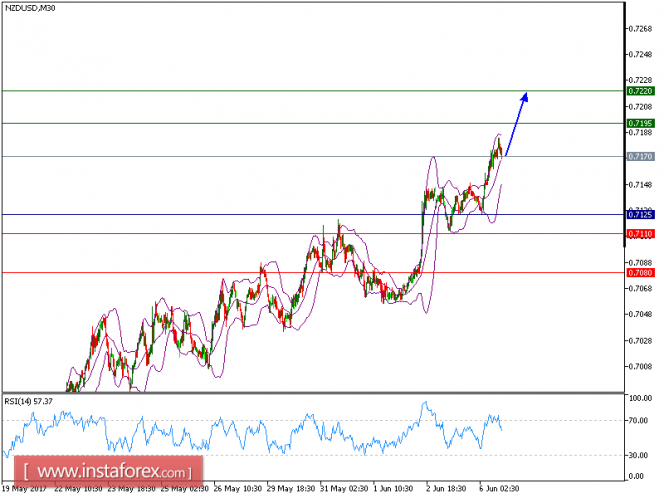
The pair moved as predicted yesterday and all our targets were hit. At present, the pair is trading above its pivot point. It is likely to trade in a higher range as long as it remains above its pivot point. Therefore, long position is recommended with the first target at 0.7195 and the second one at 0.7220. In the alternative scenario, short position is recommended with the first target at 0.7110 if the price moves below its pivot points. A break of this target is expected to push the pair further downwards, and one may expect the second target at 0.7080. The pivot point lies at 0.7125.
Strategy : BUY at dips, Stop Loss: 0.7125, Take Profit: 0.7195
Graph Explanation: The black line shows the pivot point; the present price above pivot point indicates the bullish position and below pivot points indicates the short position. The red lines shows the support levels and the green line indicates the resistance levels. These levels can be used to enter and exit trades.
Resistance levels: 0.7195, 0.7220, and 0.7280
Support levels: 0.7110,0.7080, and 0.7050
The material has been provided by InstaForex Company - www.instaforex.com