Trading plan for 19/05/2017:
Financial markets were calm overnight, which can be attributed to the lack of events this week. After the US stock markets managed to bounce, the overnight session in Asia was calm as well. Shanghai Composite lost 0.1%, but Nikkei was up 0.3%. The currency market moves in flat drifts, only Crude Oil gains slightly.
On Friday 19th of May, the event calendar is light in important economic releases, but market participants will pay attention to Consumer Price Index and Retail Sales from Canada. Commodity traders will wait for Baker Hughes U.S. Rig Count later in the day.
USD/CAD analysis for 19/05/2017:
The Consumer Price Index and Retail Sales data from Canada are scheduled for release at 12:30 pm GMT. Global investors expect the CPI to increase from 0.2% to 0.5% on a monthly basis and from 1.6% to 1.7% on a yearly basis. The Retail Sales are also expected to increase after a 0.6% drop last month and the expected reading is 0.4%. The bigger advance in CPI means that more room is left for Bank of Canada to keep the low-interest rate policy for a longer period of time. The current BoC inflation projections are at the level of 2.0% or above, so there is still some time to wait for more data while maintaining the wait-and-see approach.
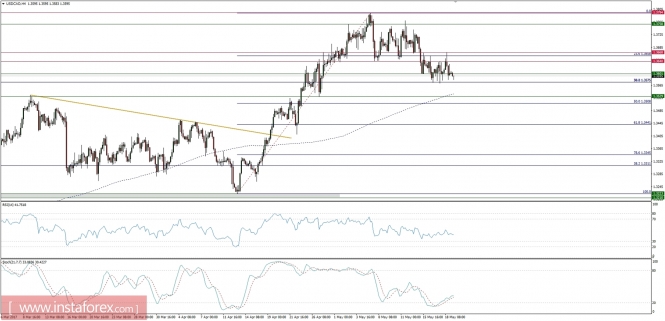
Let's now take a look at the USD/CAD technical picture on the H4 timeframe. The market is still trading inside of a tight horizontal zone between the levels of 1.3575 - 1.3668, but the market conditions are oversold, so there is still a chance for another test of the resistance. The momentum is rather flat, but the price is still trading above the 200-period moving average. In case of a further downside breakout, the next technical support is seen at the level of 1.3529 at the 61%Fibo at the level of 1.3508.
Market snapshot: Crude Oil erases the losses
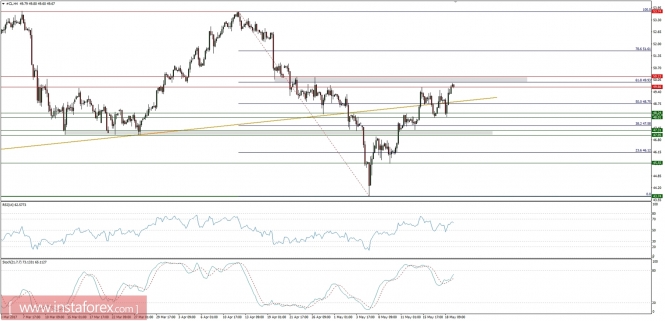
Crude Oil is trading just below the important technical resistance at the level of $49.93. Any breakout above this level will lead to the test of the next technical resistance at the level of $50.23. This is the line in the sand for bears, as any violation of this level will indicate the bullish camp is in control over this market. The next target for them would be at the level of $51.61.
Market snapshot: Gold rejected at technical resistance
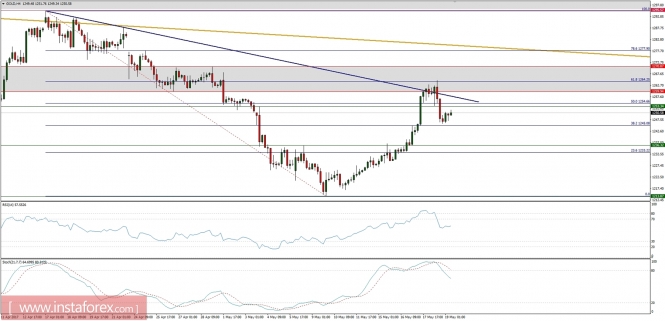
The prices of Gold are now testing the 38%Fibo at the level of $1,245 after being rejected at the technical resistance at the level of $1,264. The immediate resistance is seen at the level of $1,253 and due to the weak upside momentum, the bias remains to the downside until the market will hit the oversold levels again.
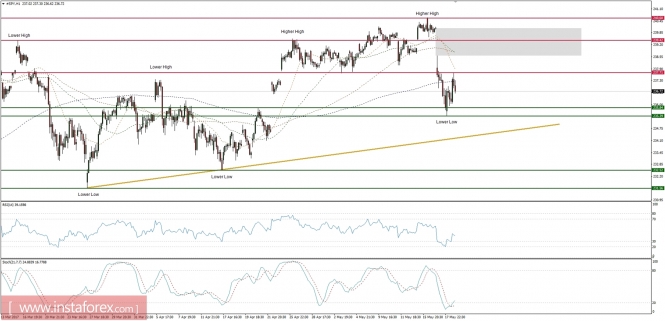
Market snapshot: SPY is bouncing after sell-off
The prices of SPY (SP500 ETF) are now bouncing higher after the sell-off to the level of 235.39. The price is trading in a range between the levels of 237.71 and 235.39 in oversold market conditions. More horizontal price action is expected in this market unless the political situation in the US gets worse.