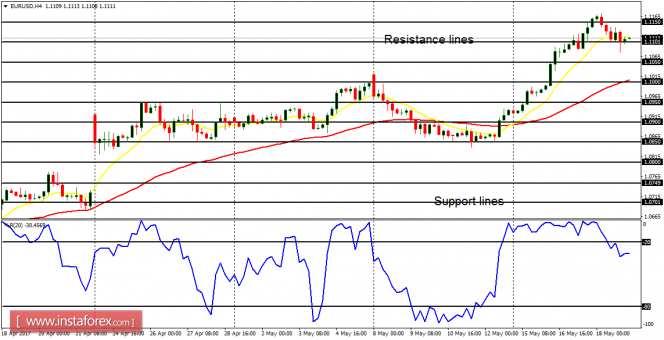
EUR/USD: This pair went upwards this week, gaining 240 pips and moving briefly above the resistance level at 1.1150, before the shallow southward correction that is currently being witnessed. The bullish outlook on the market remain intact – the EMA 11 is above the EMA 56 and the RSI period 14 is above the level 50. Price is supposed to go more upwards.
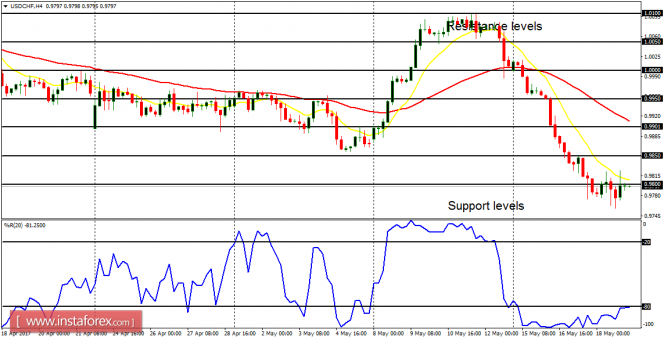
USD/CHF: There is a Bearish Confirmation Pattern on the USD/CHF 4-hour chart. Price has dropped 220 pips this week, and it has dropped 290 pips since last Friday. A further bearish movement is possible next week (because price may only consolidate for the rest of today), which would take price towards the support levels at 0.9750 and 0.9700.

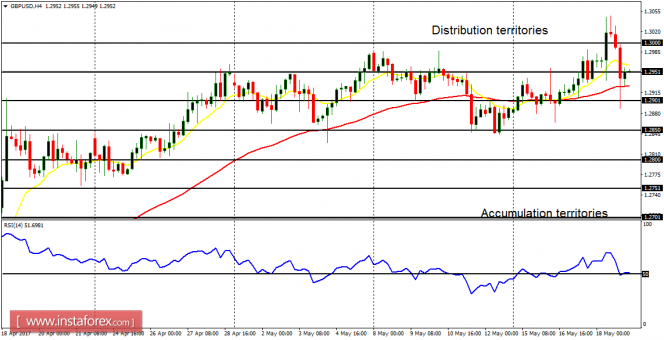
GBP/USD: This currency trading instrument is neutral in the medium term and bullish in the short term. The distribution territories at 1.3000 could be tested, and a movement above it could result in a bullish bias on the market. Since the EUR/USD is currently bullish, and it is positively correlated with GBP/USD.GBP/USD is expected to be pulled upwards very soon. The long-term bias is bullish.
USD/JPY: There is a Bearish Confirmation Pattern on the USD/JPY 4-hour chart. Price has gone down seriously this week, and the demand levels at 111.00, 110.50, and 111.00 would be tested soon. The demand levels at 111.00 and 110.50 have been tested earlier prior to the current shallow rally.
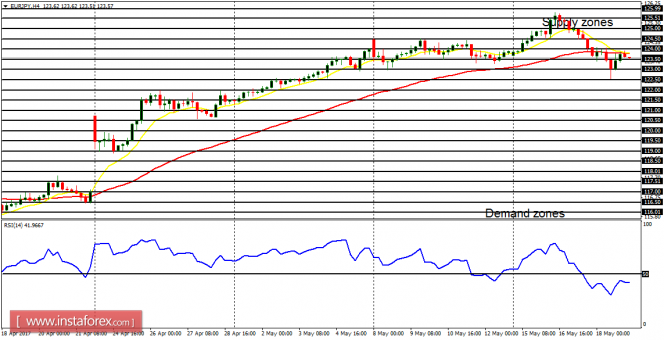
EUR/JPY: There is essentially a bearish signal on the EUR/JPY cross. The bearish movement that happened this week has resulted in short-term bearishness on the chart. A further bearish movement is possible, which could take price towards the demand zones at 123.00 and 122.50 today or next week.