Trading plan for 17/05/2017:
The US Dollar is losing ground on Wednesday in reaction to a political scandal in Washington. The stock market is put under the pressure be the worsening sentiment. The Shanghai Composite lost 0.2%, while Nikkei is down 0.6%. A weak API report lowers crude oil prices. In that situation, gold is appreciating, trading at the level of $1243 at the time of writing.
On Wednesday 17th of May, the event calendar is bereft of any important economic data, but market participants will pay attention to the claimant count change from the UK, the consumer price index from the eurozone and the manufacturing sales from Canada.
Analysis of GBP/USD for 17/05/2017:
A set of data from the UK's labor market, including the claimant count change, is scheduled for release at 10:30 am GMT. Market participants expect, that the unemployment rate will remain unchanged at the level of 4.7%, but the average earnings index should increase from 2.3% to 2.4%. The number of individuals who are out of work and who are claiming some sort of unemployment benefit is expected at the level of 10K people, while last month this number was 25.5K people. A softer conditions on the labour market will give the Bank of England an excuse to keep low-interest rates intact for some time.
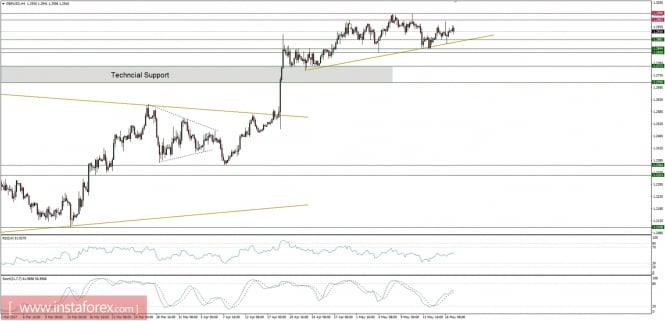
Let's now take a look at the GBP/USD technical picture on the H4 timeframe. The market is still trading between the levels of 1.2281 - 1.2963, just above the golden trend line. There is a clear bearish divergence visible between the price and the momentum oscillator, so the bias remains to the downside. In case of a breakout, the market should test the technical support at 1.2844 and 1.2828. Only a sustained break below the level of 1.2772 would change the long-term bias to bearish.
Analysis of EUR/USD for 17/05/2017:
The consumer price index data is scheduled for release at 11:00 am GMT and market participants expect no change in CPI (1.9%) and Core CPI (1.2%). Importantly, any increase in inflation will give a food for thought for the ECB regarding their current interest rates policy.
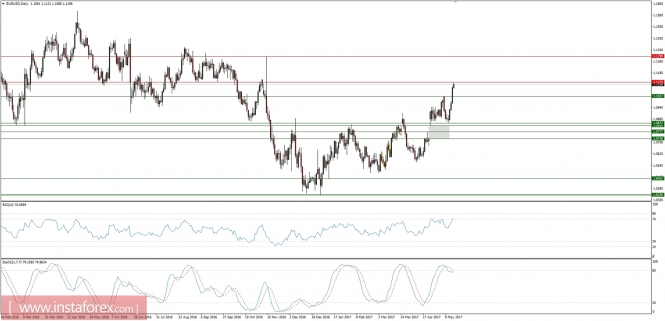
Let's now take a look at the EUR/USD technical picture on the H4 timeframe. The market is still advancing despite the overbought market conditions. The immediate support is seen at the level of 1.1022, but so far no signs of a reversal have been seen on the chart. The long-term technical resistance lies at the level of 1.1298.
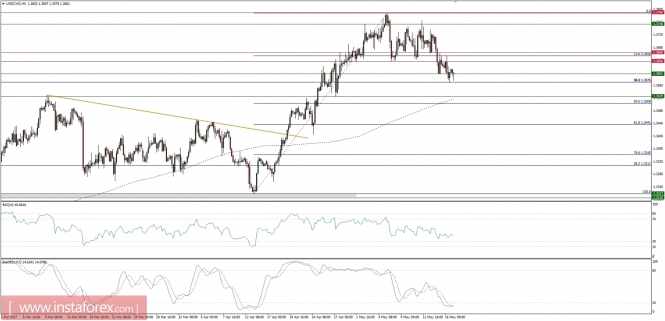
Market snapshot: USD/CAD hits 50% retracement
The USD/CAD pair has hit the 50% Fibo retracement of an upswing from 1.3223 to 1.3794. The oversold market conditions and a slight bullish divergence might indicate a possible bounce from this level. In that case, the next technical resistance is seen at 1.3601 and then at 1.3640.