Short-term trend has changed to bullish in Gold as price has broken out of the 4-hour cloud resistance as expected. Gold price is approaching our target area of $1,250-60 where the important medium-term resistance is found.
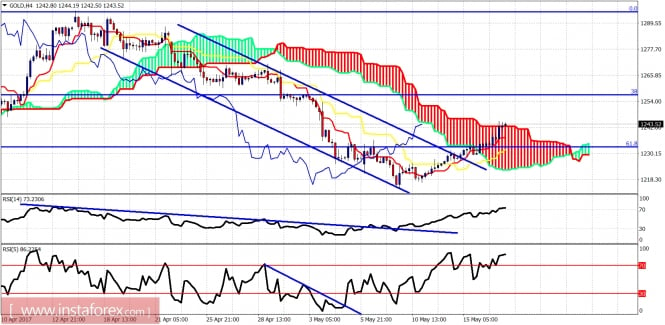
Blue lines - bearish channel (broken)
Gold price is breaking out above the Ichimoku cloud on the 4-hour chart. Trend is now bullish in the 4-hour time frame. Short-term support is at $1,217 and at $1,233. Resistance is at $1,250-60.
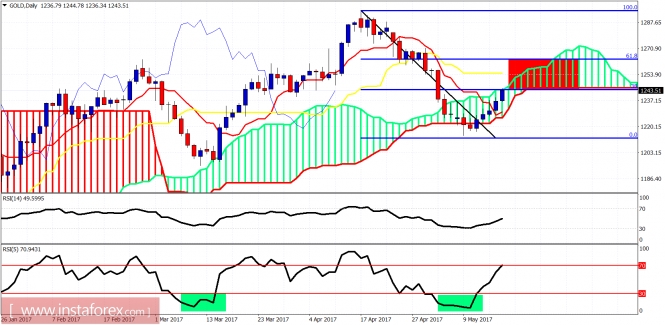
As mentioned last week, the RSI was giving bullish divergence signals similar to when Gold price was at $1,194. Price responded the same way and is now more than 20$ higher from recent lows. Gold price has resistance at $1,254 where the daily kijun-sen is found and at $1,260 where the 61.8% Fibonacci retracement is. Breaking above these levels will be very bullish. A rejection here could push Gold back to $1,220.The material has been provided by InstaForex Company -
www.instaforex.com
