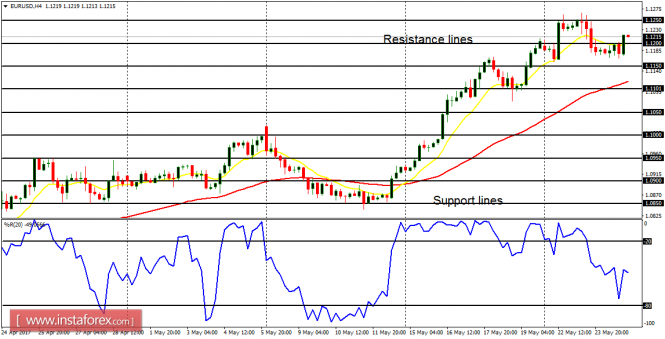
EUR/USD: The EUR/USD pair has not made any serious directional movement this week in the context of an uptrend. Price has moved between the support line at 1.1150 and the resistance line at 1.1250 (which has been tested several times this week). The resistance line is supposed to be breached to the upside as the market trends upwards.
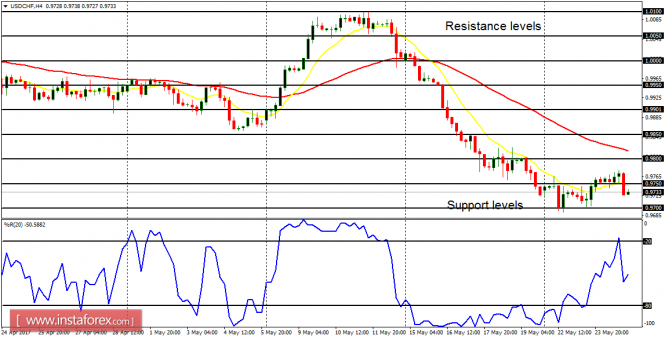
USD/CHF: A bearish signal remains valid on USD/CHF, although price has moved largely sideways this week (in the context of a downtrend). A rise in momentum is anticipated, which would happen this week or next, and which would most probably favor bears.
GBP/USD: The GBP/USD pair has consolidated so far this week. The market is quite choppy with no clear direction, and further consolidation may change the bias on the market to a neutral bias. There are no many fundamental data today, and thus, we may not witness serious movements in the market.

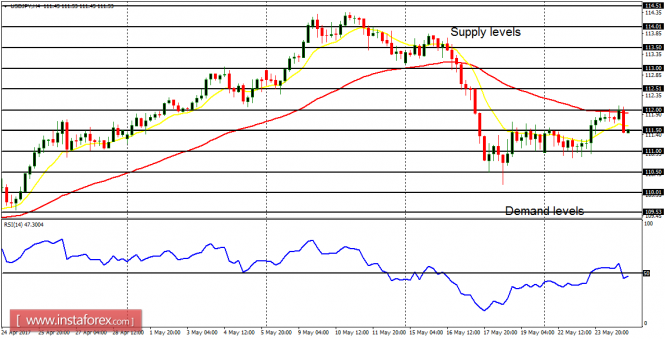
USD/JPY: There is still a Bearish Confirmation Pattern on the USD/JPY 4-hour chart. The EMA 11 is below the EMA 56 and the RSI period 14 is below the level 50. There could be a further bearish movement, which could take price towards the demand levels at 111.00 and 110.50; or there could be a rally, which might threaten the currently precarious bearish bias.
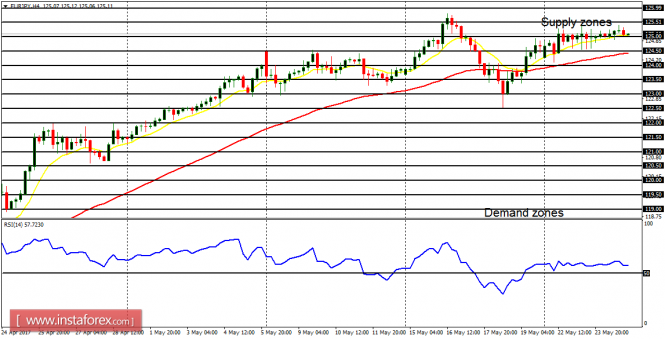
EUR/JPY: Just like USD/JPY, this cross pair has also consolidated so far this week. There is a bullish indication on the 4-hour chart. The EMA 11 is above 56, while the RSI period 14 is above the level 50. A breakout to the upside is expected before the end of this week or early next week, which may enable the supply zones at 125.50, 126.00, and 126.50 to be tested.