Gold price has stopped rising from $1,230 at $1,290-95 area where the long-term resistance is found. A pullback is justified towards $1,270 at least but this will happen only if we break below $1,280.
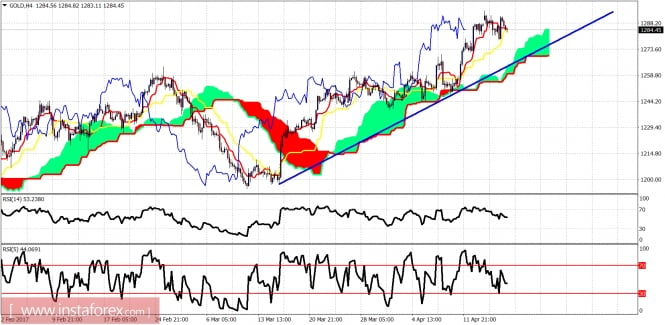
Blue line - trend line support
Gold price is trading above the Kumo cloud and is making higher highs and higher lows. Price is testing kijun-sen (yellow line indicator) support at $1,283. A daily close below $1,280 will open the way for a push towards $1,260-70. Resistance is at $1,293.
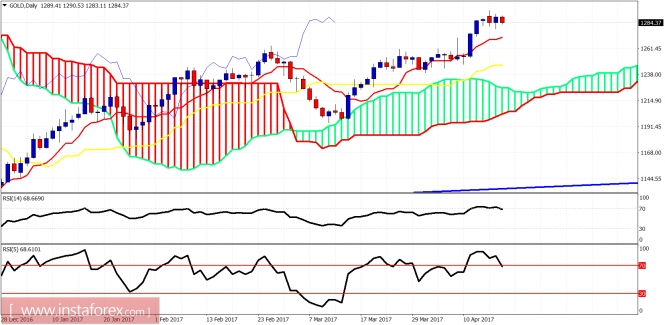
A bullish trend can be clearly seen on a daily time frame, but the overbought signs make me worry of a possible pullback towards even the $1,220 level. This is where daily support by the cloud is found. Kijun-sen daily support indicator is at $1,245 which is also an important support level. Overall, I remain longer-term bullish but would only buy or add after a pullback.The material has been provided by InstaForex Company -
www.instaforex.com
