
The US dollar index remains weak after breaking below the 61.8% Fibonacci retracement support at 99.70. The trend is bearish and I expect to see a bounce from lower levels around 99. I expect the dollar index to test the important support at 99-98.80.
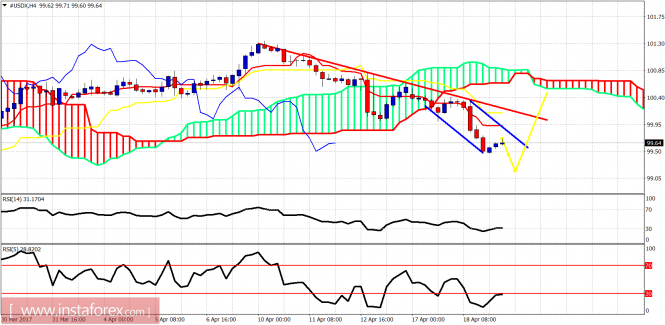
Blue lines - bearish channel
Yellow lines - price projection
The trend is bearish in the short term as the price is trading below both tenkan- and kijun-sen indicators. Oscillators are giving us a warning for a possible bounce but there are not enough divergence signals to convince me that the bounce will come today. I would be more patient and wait for a move lower towards 99. Why 99?
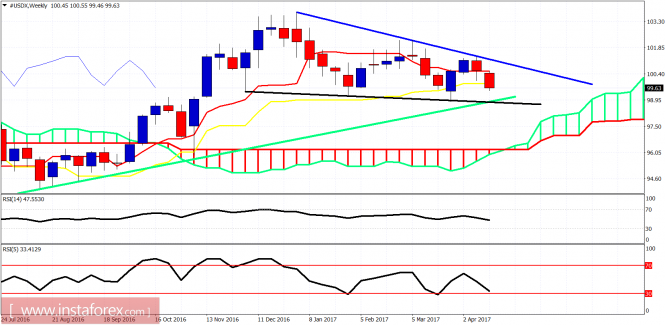
Black line - support
Green line - long-term trend line support
The weekly candle has broken below the kijun-sen support and is heading towards the black and green support trend lines. 99 is where the support on the weekly chart is found, and I believe that if a bounce is coming, it will come from that price level back towards the blue trend line at least.
The material has been provided by InstaForex Company - www.instaforex.com