
The index is trying to gather enough bullish momentum in order to break above the resistance zone of 102.39. If that happens, bulls should produce a rally to test the 103.40 level in the short-term. However, if USDX plummets at the current stage and breaks below yesterday's lows, it can reach the 100.44 level across the board.
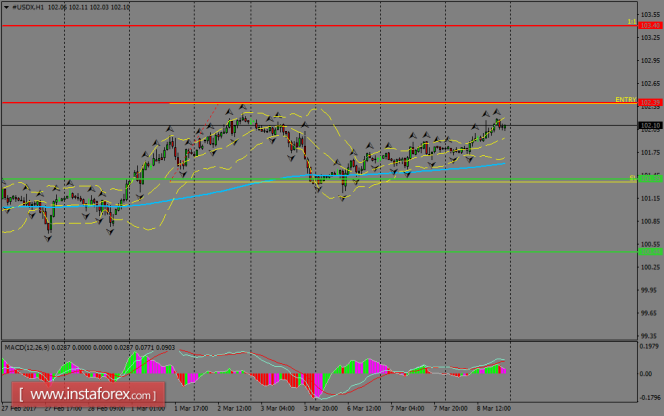
H1 chart's resistance levels: 102.39 / 103.40
H1 chart's support levels: 101.39 / 100.44
Trading recommendations for today: Based on the H1 chart, place buy (long) orders only if the USD Index breaks with a bullish candlestick; the resistance level is at 102.39, take profit is at 103.40 and stop loss is at 101.35.
The material has been provided by InstaForex Company - www.instaforex.com