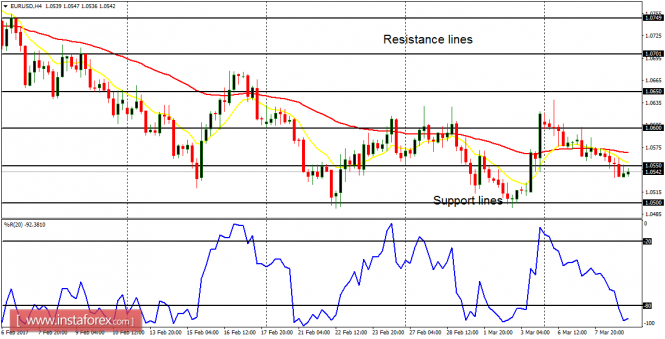
EUR/USD: There is a "sell" signal on the EUR/USD pair. The price moved below the resistance line at 1.0550 yesterday, going towards the support lines at 1.0500 and 1.0450. Some fundamental figures are expected today and they can have some impact on the market.
USD/CHF: The USD/CHF pair has tested the resistance level at 1.0150 and it is bound to test it once again. The blls are willing to push the price beyond that resistance level, targeting another resistance levels at 1.0200 and 1.0250. But right now, the resistance level is under siege, since the price is yet to breach it to the upside.

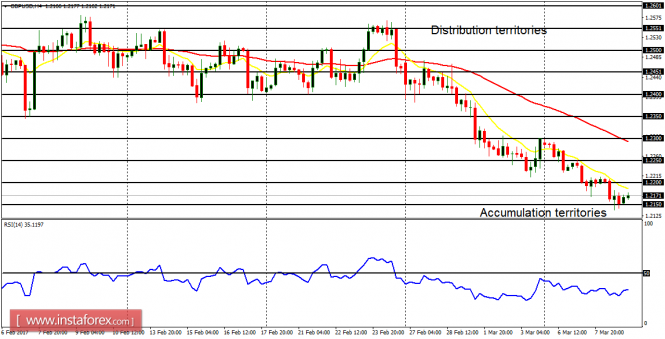
GBP/USD: This pair has gone south by 130 pips this week; having gone south by 300 pips since February 27, 2017. There is a clear Bearish Confirmation Pattern in the 4-hour chart, and further southwards movement is expected. It may make the price to go towards the accumulation territories at 1.2150, 1.2100, and 1.2050.
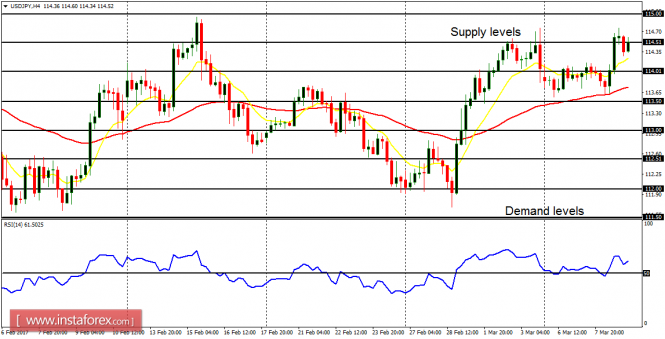
USD/JPY: On this pair, the price managed to break upwards yesterday, almost going above the demand level at 114.50. The EMA 11 is above the EMA 56, and the RSI period 14 is above the level 50. It is possible for the price to reach the supply zones at 115.00, 115.50 and 116.00. These are the targets for the week.
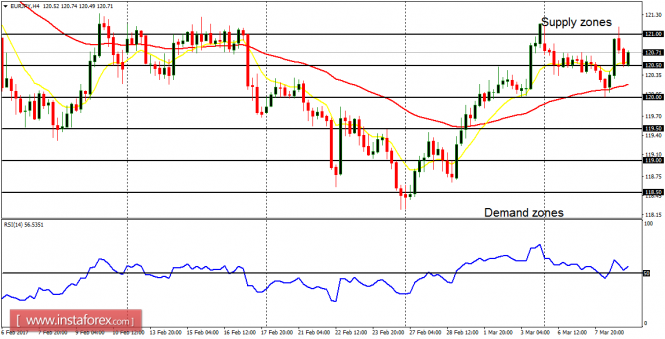
EUR/JPY: On the EUR/JPY pair, things are a bit choppy, but the outlook on the market remains bullish. There is a Bullish Confirmation Pattern in the market. The EMA 11 is above the EMA 56, while the RSI period 14 has managed to go above the level 50. Further bullish movement is possible, which may make price to reach supply zones at 121.50, 122.50, and 123.00.