
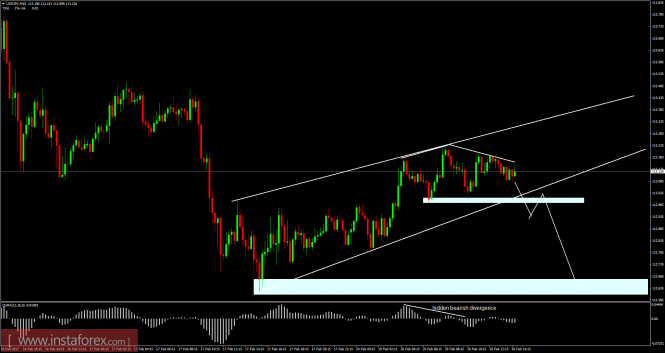
Recently, the USD/JPY pair has been trading sideways at the price of 113.15. According to the 15M time frame, I found rising wedge formation. Rising wedge formation is a bearish pattern. There is also a hidden bearish divergence, which is a sign that buying looks risky. My advice is to wait for potential breakout of lower diagonal to confirm re-continuation of the downward trend. If the price breaks the lower diagonal of the wedge, downward target will be set at the price of 112.65.
Resistance levels:
R1: 113.20
R2: 113.26
R3: 113.35
Support levels:
S1: 113.03
S2: 112.95
S3: 112.90
Trading recommendations for today: watch for potential selling opportunities.
The material has been provided by InstaForex Company - www.instaforex.com